Open Access
Fig. D.3
Download original image
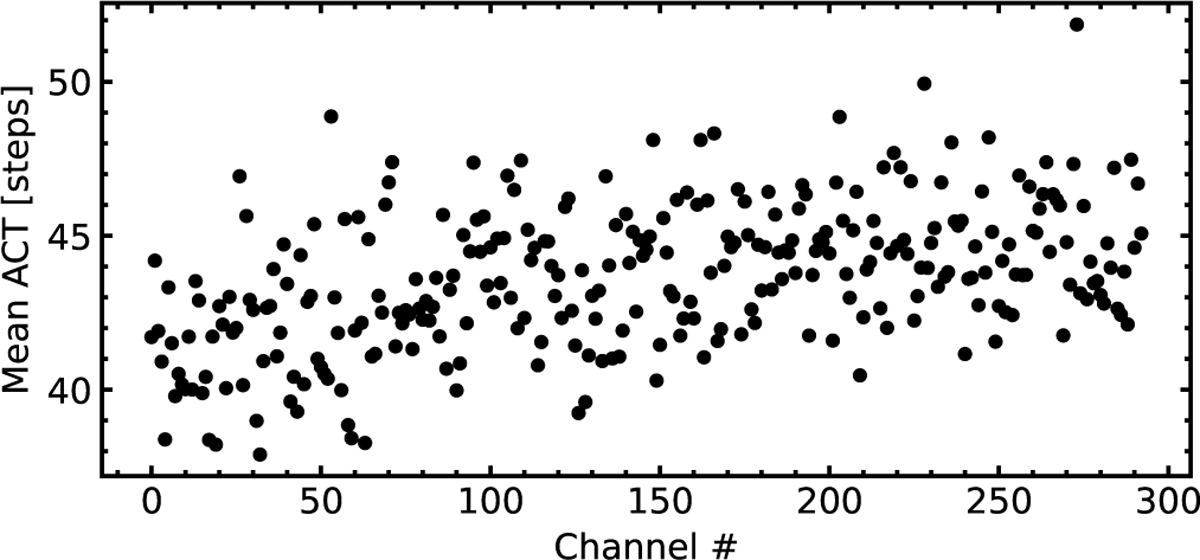
Convergence of the MCMC chains for each spectroscopic light-curve fit, showing the channel number on the x-axis, and mean auto-correlation time (in number of steps) on the y-axis. We point out that the associated mean autocorrelation time for the white light-curve fit is 60 steps.
Current usage metrics show cumulative count of Article Views (full-text article views including HTML views, PDF and ePub downloads, according to the available data) and Abstracts Views on Vision4Press platform.
Data correspond to usage on the plateform after 2015. The current usage metrics is available 48-96 hours after online publication and is updated daily on week days.
Initial download of the metrics may take a while.