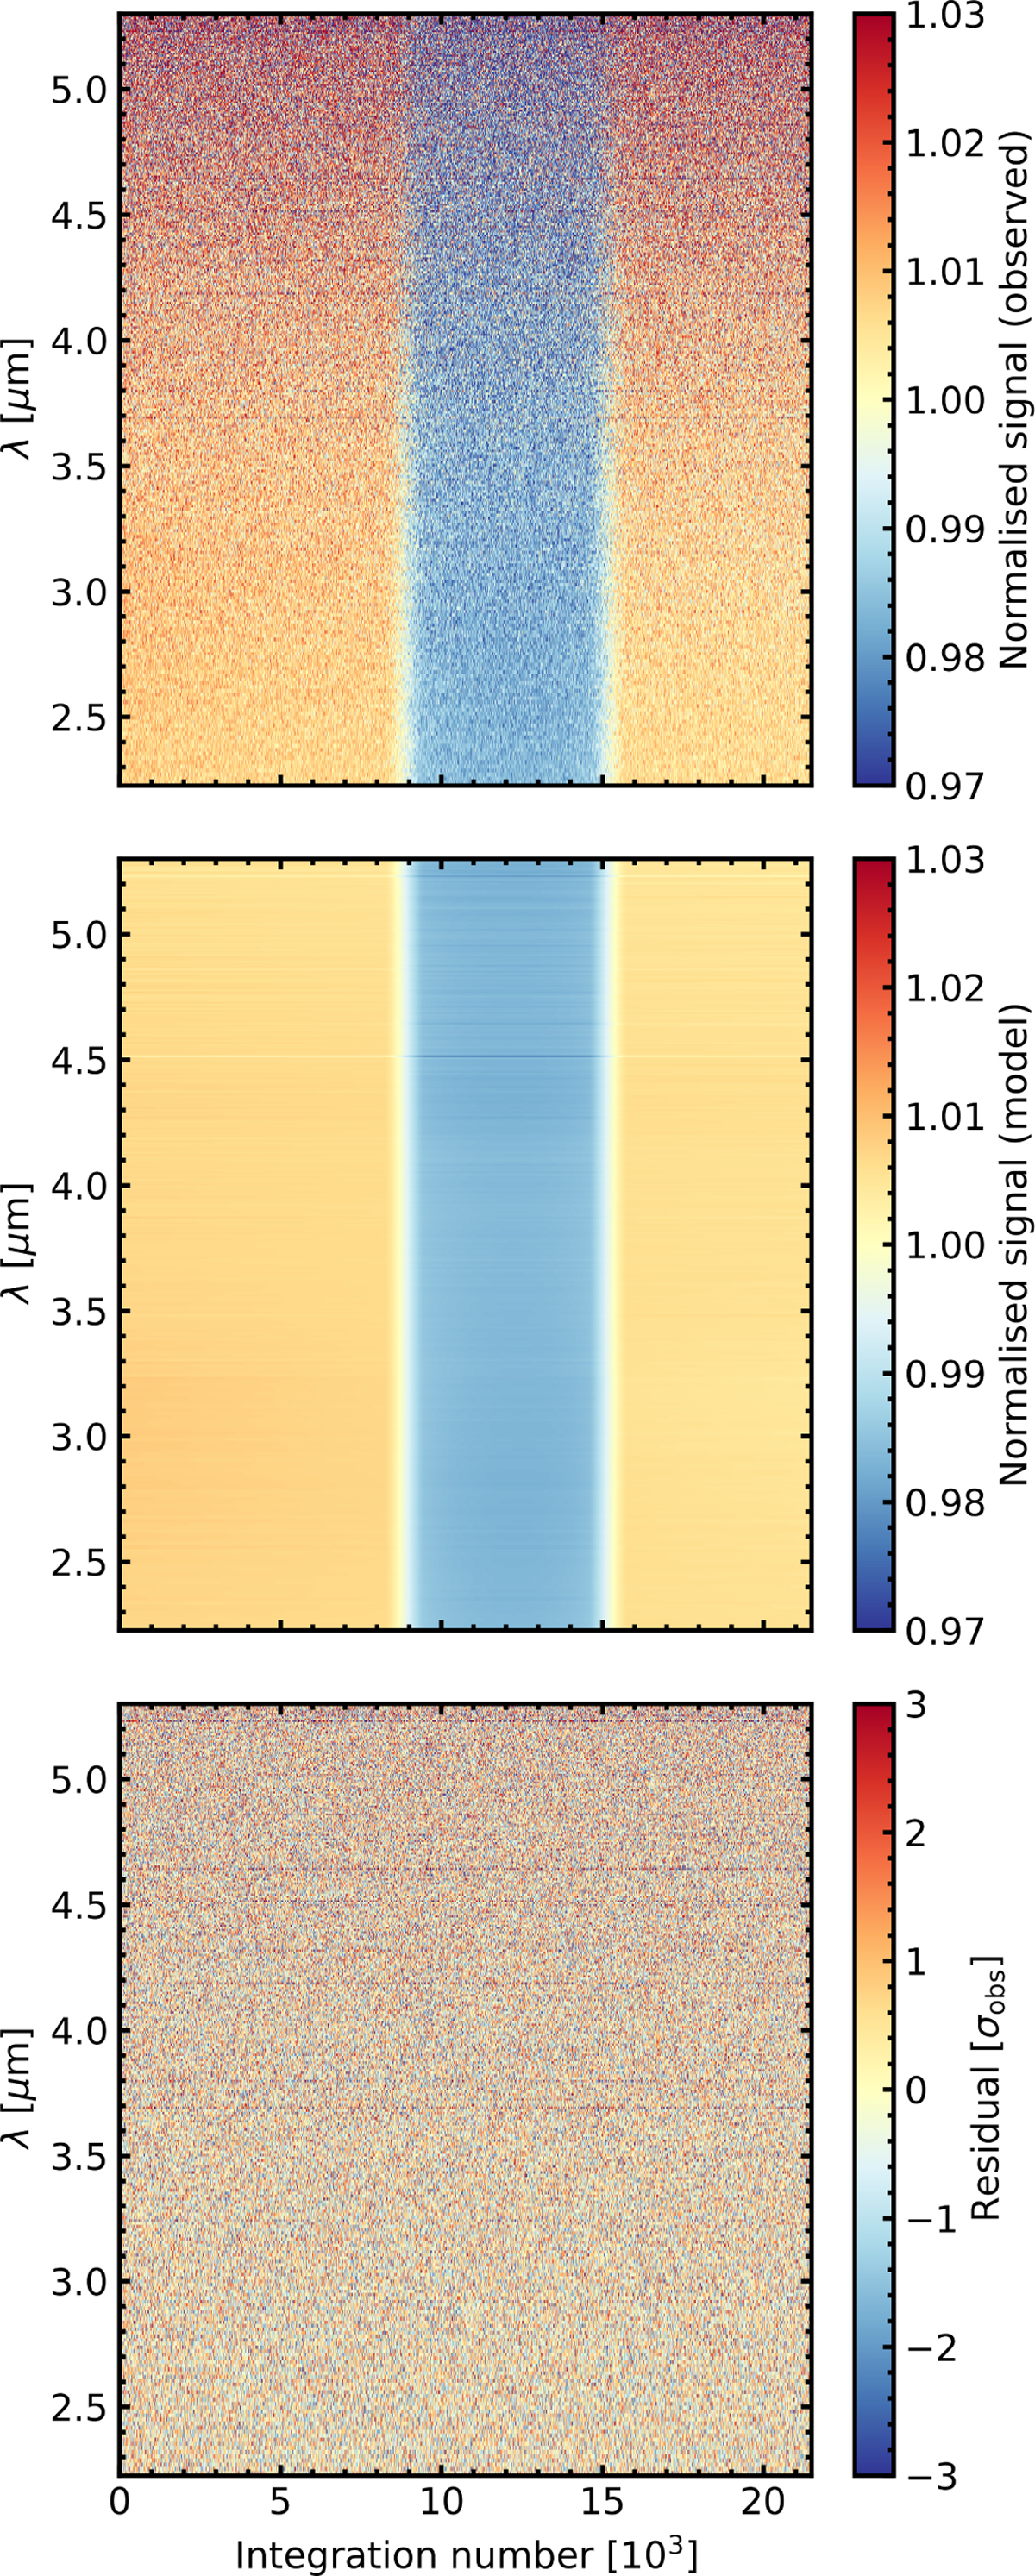
Fig. D.4
Download original image
Data reduction results from Eureka!, showing integration number (equivalent to time) on the x-axis, and wavelength (in μm) on the y-axis. Top: Dynamic light-curve as resulting from stage 4 of Eureka!, with the colour-bar indicating mean-normalised signal. Middle: Combined systematic and astrophysical light-curve fits from stage 5 of Eureka!, with the colour-map representing the same parameters as in the left panel. Bottom: Fit residuals, normalised to the measurement-associated uncertainty.
Current usage metrics show cumulative count of Article Views (full-text article views including HTML views, PDF and ePub downloads, according to the available data) and Abstracts Views on Vision4Press platform.
Data correspond to usage on the plateform after 2015. The current usage metrics is available 48-96 hours after online publication and is updated daily on week days.
Initial download of the metrics may take a while.