Fig. D.5
Download original image
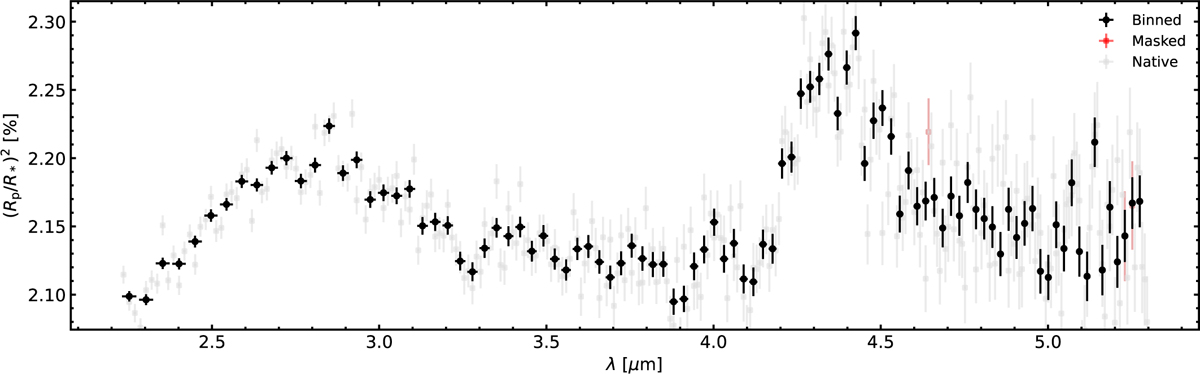
Transmission spectrum of WASP-39 b produced in this work, showing wavelength (in μm) on the x-axis against transit depth (in %) on the y-axis. Grey data points represent the transit depth values extracted at the pixel-resolution level. Black data points show the finalised transmission spectrum, binned in 3-pixel intervals. Data points marked in red are excluded from this based on Fig. D.2.
Current usage metrics show cumulative count of Article Views (full-text article views including HTML views, PDF and ePub downloads, according to the available data) and Abstracts Views on Vision4Press platform.
Data correspond to usage on the plateform after 2015. The current usage metrics is available 48-96 hours after online publication and is updated daily on week days.
Initial download of the metrics may take a while.