Fig. 3
Download original image
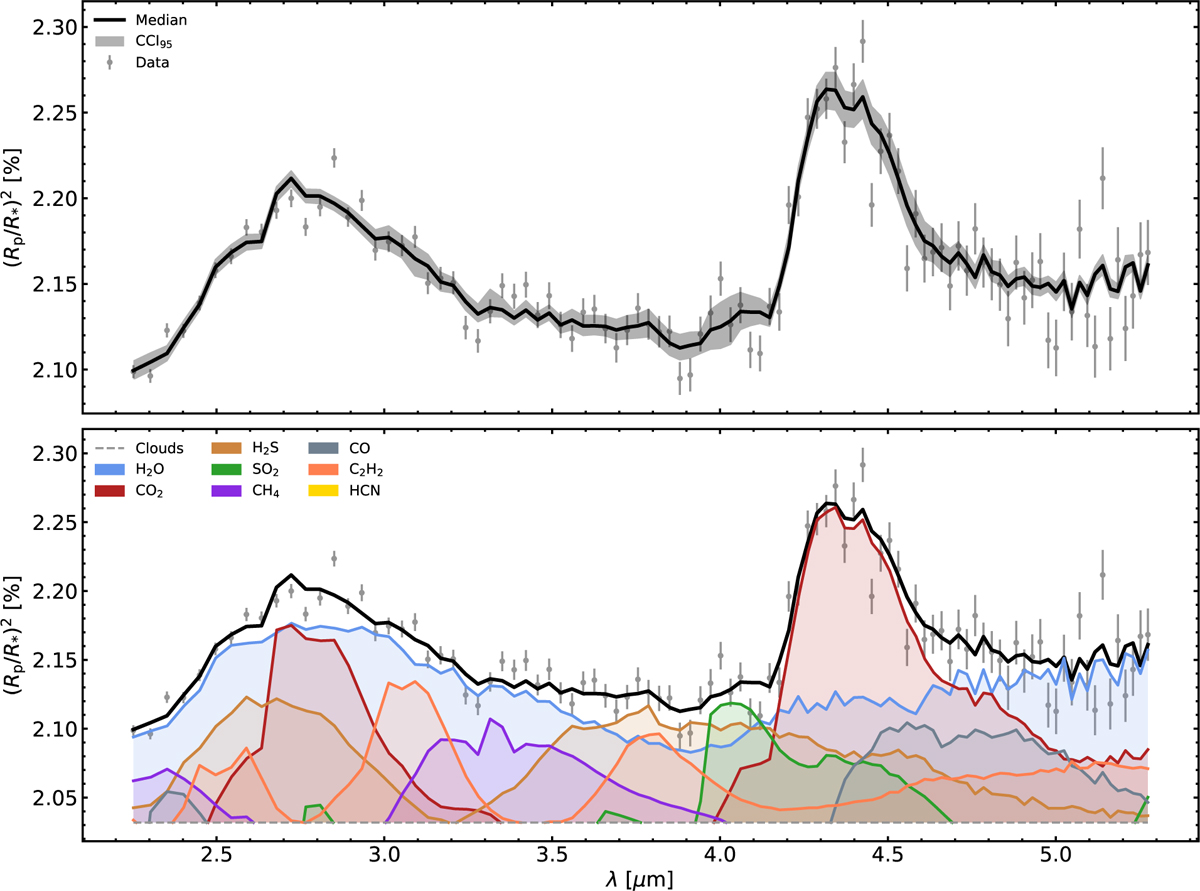
Transmission spectrum with model fit solution from model tuning process. Both panels show wavelength (in μm) on the x-axis against transit depth (in %) on the y-axis, as well as the data points and error bars (grey) from the spectrum produced in this work (SP-TW). (Top) Median model solution (solid black line) and corresponding 95% CCI (shaded area). (Bottom) Contributions of individual molecular opacity sources (colour-coded by molecule) and the flat-opacity cloud deck (dashed grey line).
Current usage metrics show cumulative count of Article Views (full-text article views including HTML views, PDF and ePub downloads, according to the available data) and Abstracts Views on Vision4Press platform.
Data correspond to usage on the plateform after 2015. The current usage metrics is available 48-96 hours after online publication and is updated daily on week days.
Initial download of the metrics may take a while.