Fig. 5
Download original image
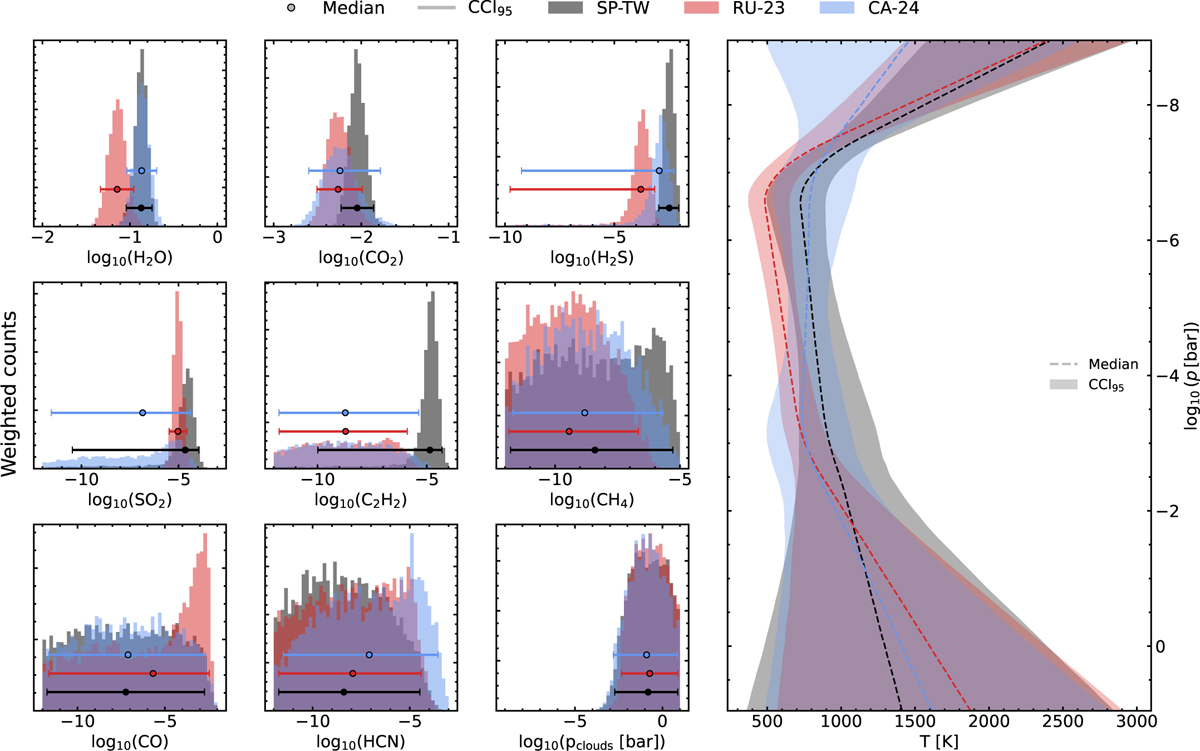
Results of atmospheric retrieval performed on three transmission spectra derived from the same observation. Results achieved with SP-TW (the spectrum produced in our work), as well as with RU-23 and CA-24, are shown in black, red, and blue, respectively. (Left) The grid of smaller panels shows the marginalised posterior distributions of the molecular mixing ratios and cloud-top pressure (Right) Retrieved 4-point pressure temperature profiles, where dashed lines indicate the posterior median, and shaded area the corresponding CCI95.
Current usage metrics show cumulative count of Article Views (full-text article views including HTML views, PDF and ePub downloads, according to the available data) and Abstracts Views on Vision4Press platform.
Data correspond to usage on the plateform after 2015. The current usage metrics is available 48-96 hours after online publication and is updated daily on week days.
Initial download of the metrics may take a while.