Fig. D.1
Download original image
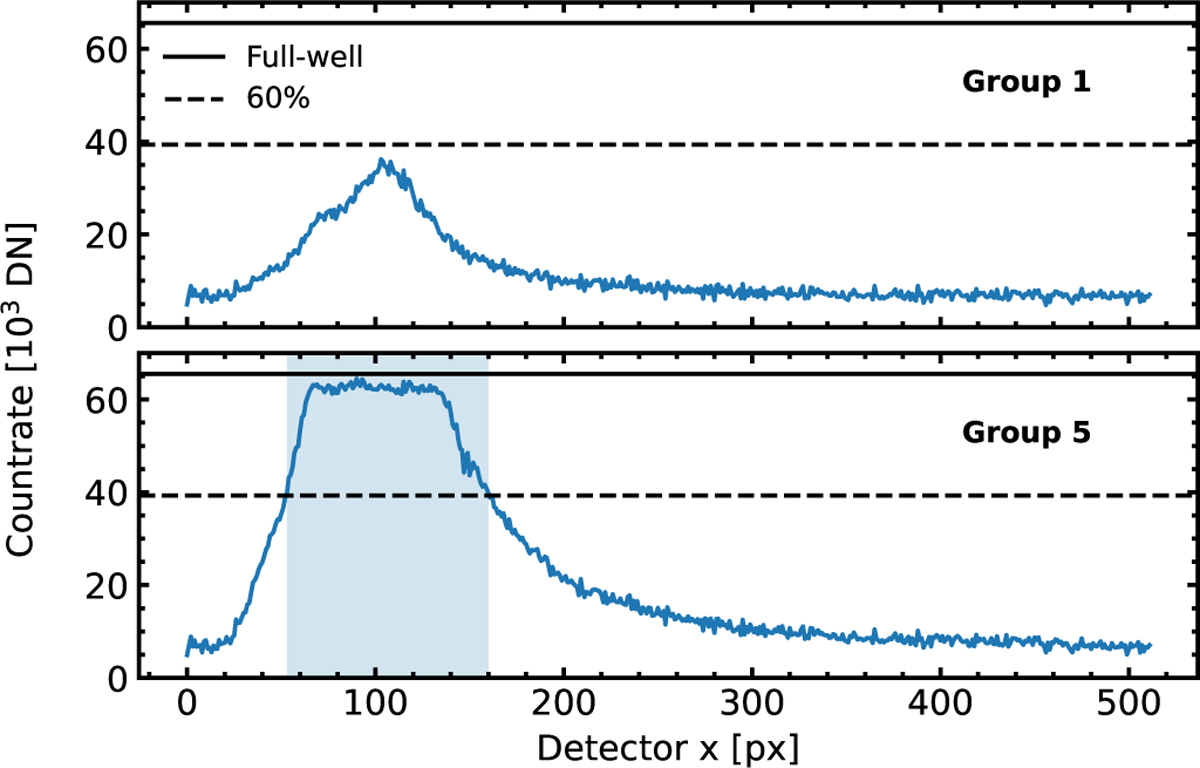
Median signal for row 16, showing dispersion-direction pixel position on the x-axis, and received signal in DN on the y-axis, for the first (top panel) and fifth (bottom panel) group. The solid black line denotes the full-well value, while the dashed black line marks the 60 % saturation threshold. The blue shaded area indicates the range in dispersion direction that falls above the 60 % saturation threshold.
Current usage metrics show cumulative count of Article Views (full-text article views including HTML views, PDF and ePub downloads, according to the available data) and Abstracts Views on Vision4Press platform.
Data correspond to usage on the plateform after 2015. The current usage metrics is available 48-96 hours after online publication and is updated daily on week days.
Initial download of the metrics may take a while.