Fig. D.2
Download original image
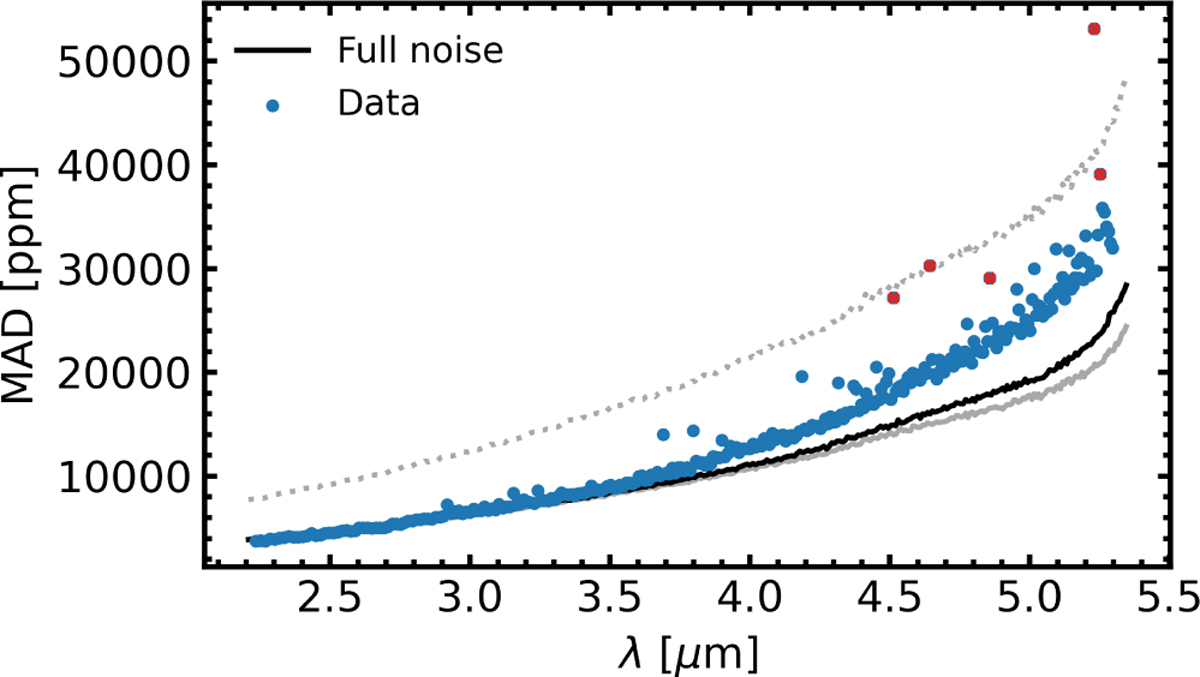
Spectroscopic light-curve precision, showing wavelength (in μm) on the x-axis, and the median-absolute deviation (MAD, in ppm) on the y-axis. The MAD-values from our data reduction (blue points) are compared to the photon-noise contribution (grey solid line) from a JexoSim simulation. The black solid line shows the corresponding full noise budget, and the grey dashed line represents twice the photon-noise contribution. Individual channels deviating by a factor of 1.75 from the photon-noise contribution (red crosses) are not considered in further analysis.
Current usage metrics show cumulative count of Article Views (full-text article views including HTML views, PDF and ePub downloads, according to the available data) and Abstracts Views on Vision4Press platform.
Data correspond to usage on the plateform after 2015. The current usage metrics is available 48-96 hours after online publication and is updated daily on week days.
Initial download of the metrics may take a while.