Fig. 1.
Download original image
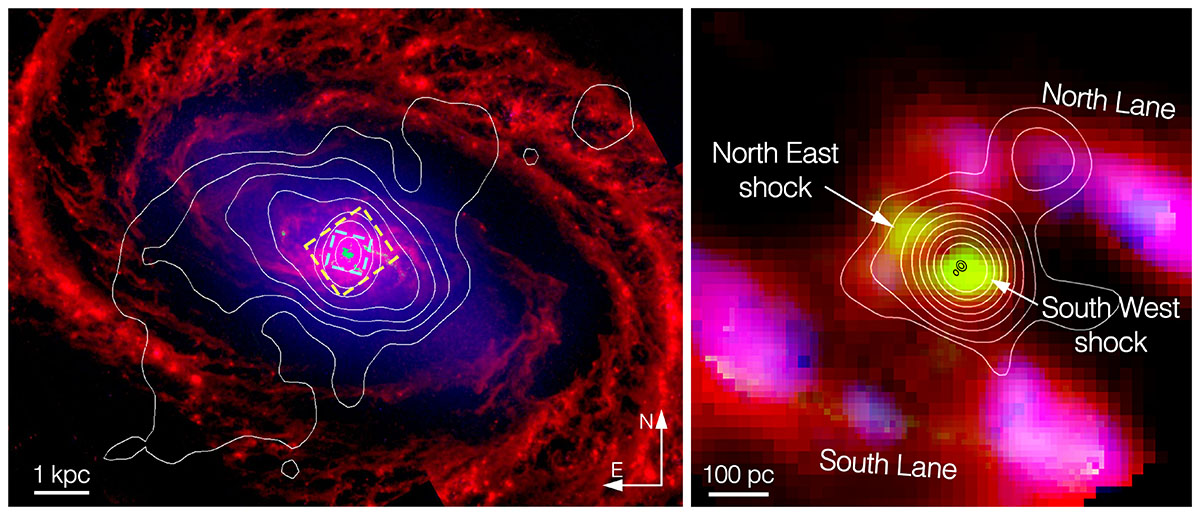
Left: Composite image showing F200W (blue; stellar continuum), continuum-subtracted H2 1– S(1) from F212N (green), and F770W (red; tracing PAH 7.7 μm emission). The LOFAR 144 MHz radio contours are overlaid. The NIRSpec and MIRI Channel 4 fields of view are shown with cyan and yellow dashed lines, respectively. Right: Zoom-in highlighting warm molecular gas traced by H2 S(9) (green), S(1) (red), and CO 2-1 (blue). Overlaid contours are C band from VLA (white) and MERLIN (black). Key regions are labeled, including the northern and southern dust lanes as well as shocked regions to the northeast and southwest. Physical scale bars are shown in both panels.
Current usage metrics show cumulative count of Article Views (full-text article views including HTML views, PDF and ePub downloads, according to the available data) and Abstracts Views on Vision4Press platform.
Data correspond to usage on the plateform after 2015. The current usage metrics is available 48-96 hours after online publication and is updated daily on week days.
Initial download of the metrics may take a while.