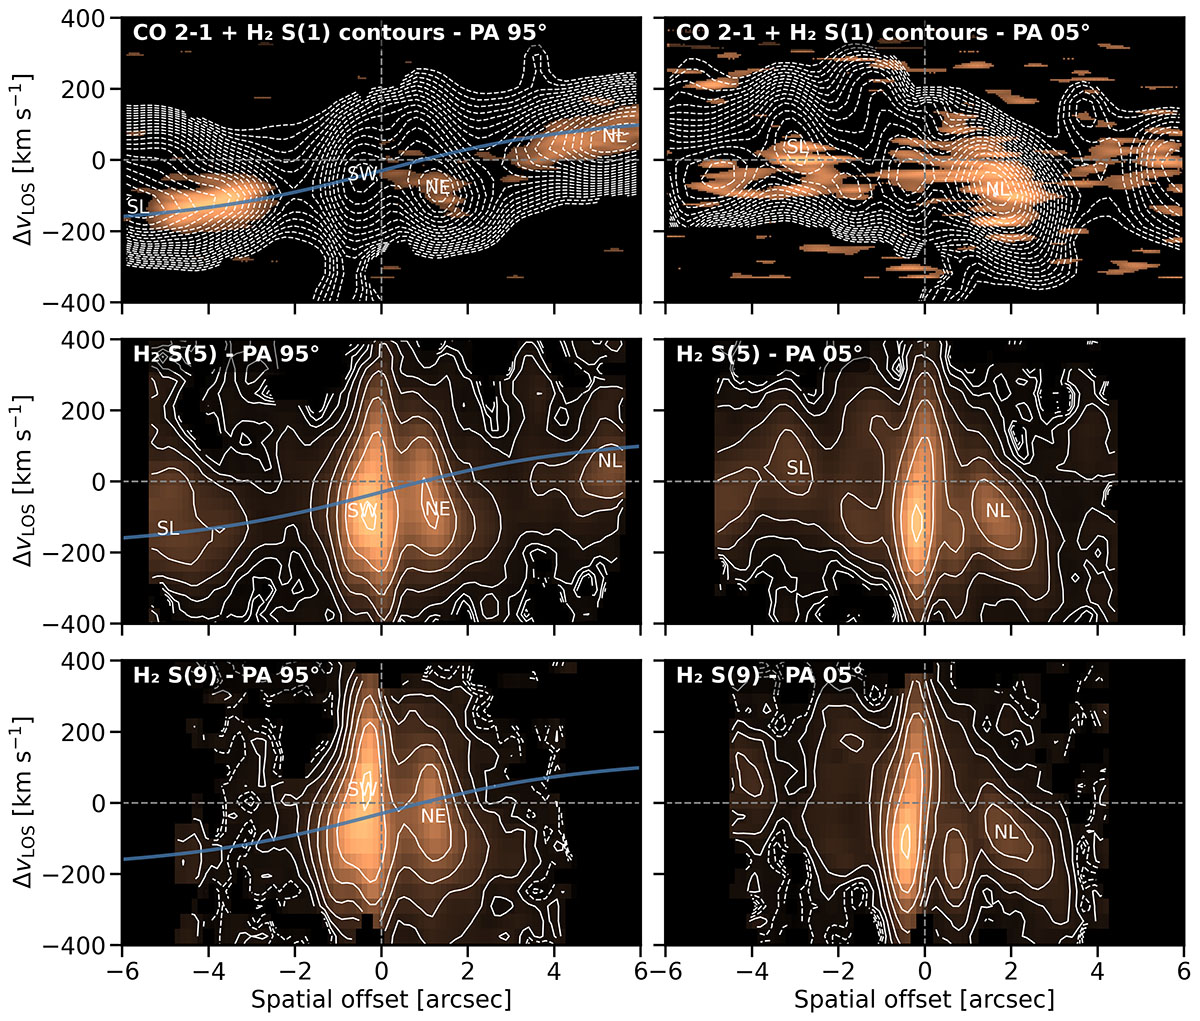
Fig. 11.
Download original image
PV diagrams of molecular gas emission along the major (PA = 95°) and minor (PA = 5°) axes of the galaxy. Top row: CO(2–1) emission from GB09 as a color map, with white contours of the H2 S(1) line overlaid. A velocity shift of 30 km s−1 was applied to the CO data to match our systemic velocity. Second and third rows: H2 S(5) and S(9) emission lines, respectively. In all major-axis panels, the blue line marks the best-fit CO rotation curve. Contours begin at 10σ.
Current usage metrics show cumulative count of Article Views (full-text article views including HTML views, PDF and ePub downloads, according to the available data) and Abstracts Views on Vision4Press platform.
Data correspond to usage on the plateform after 2015. The current usage metrics is available 48-96 hours after online publication and is updated daily on week days.
Initial download of the metrics may take a while.