Fig. A.1.
Download original image
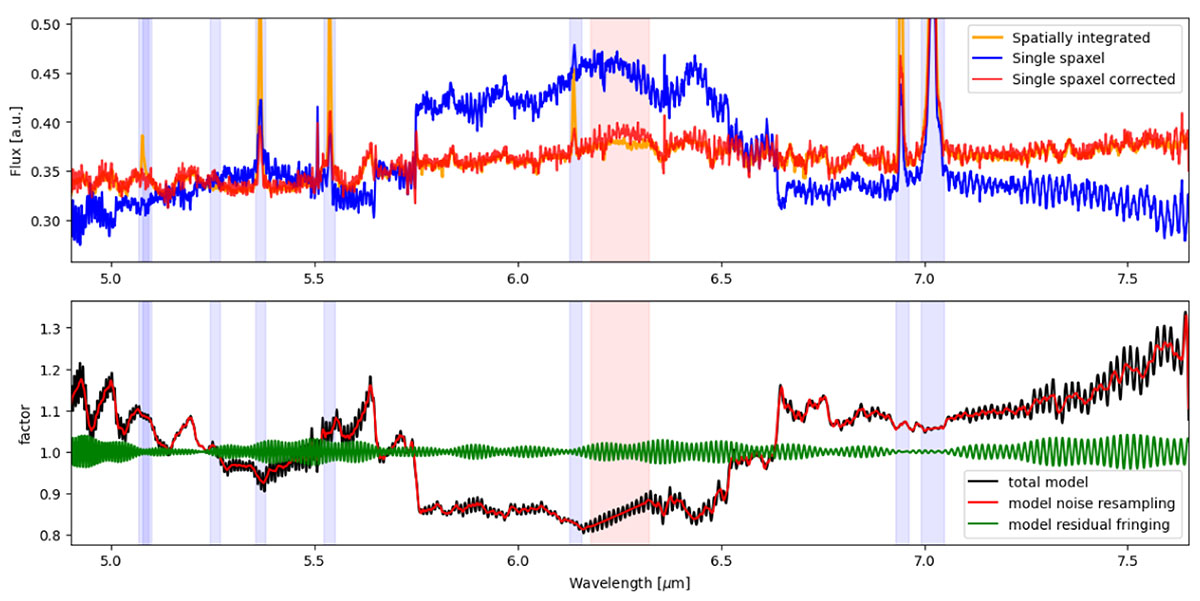
Example of the spaxel correction method. Top panel: Original spaxel spectrum (blue), its reference continuum (orange), and corrected spectrum (red). Bottom panel: Correction factor for each wavelength and the fringing pattern derived from the JWST pipeline. Masking lines and PAH features are shown in the shaded-blue and shaded-red areas, respectively.
Current usage metrics show cumulative count of Article Views (full-text article views including HTML views, PDF and ePub downloads, according to the available data) and Abstracts Views on Vision4Press platform.
Data correspond to usage on the plateform after 2015. The current usage metrics is available 48-96 hours after online publication and is updated daily on week days.
Initial download of the metrics may take a while.