Fig. 2.
Download original image
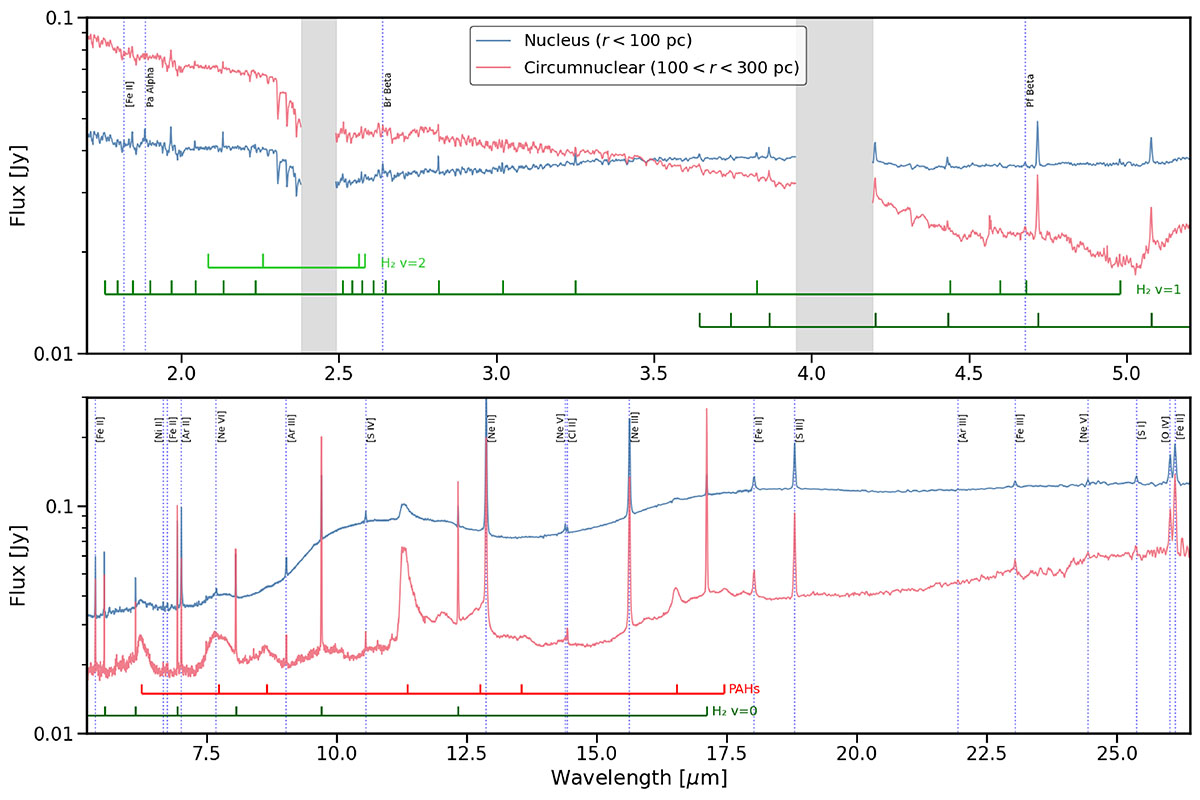
JWST spectra for the nucleus (blue) and for a circumnuclear region (red). Ionic emission lines are indicated by vertical blue lines. The PAH features and H2 lines are marked along the bottom of each panel. The circumnuclear region exhibits strong PAH emission, pure rotational H2, and low-excitation ionized lines. In contrast, the nuclear spectrum shows prominent high-ionization lines, relatively stronger H2 rovibrational lines, and two silicate features at 10 μm and 17 μm. Shaded-gray regions indicate gaps in the NIRSpec instrument.
Current usage metrics show cumulative count of Article Views (full-text article views including HTML views, PDF and ePub downloads, according to the available data) and Abstracts Views on Vision4Press platform.
Data correspond to usage on the plateform after 2015. The current usage metrics is available 48-96 hours after online publication and is updated daily on week days.
Initial download of the metrics may take a while.