Open Access
Fig. 3.
Download original image
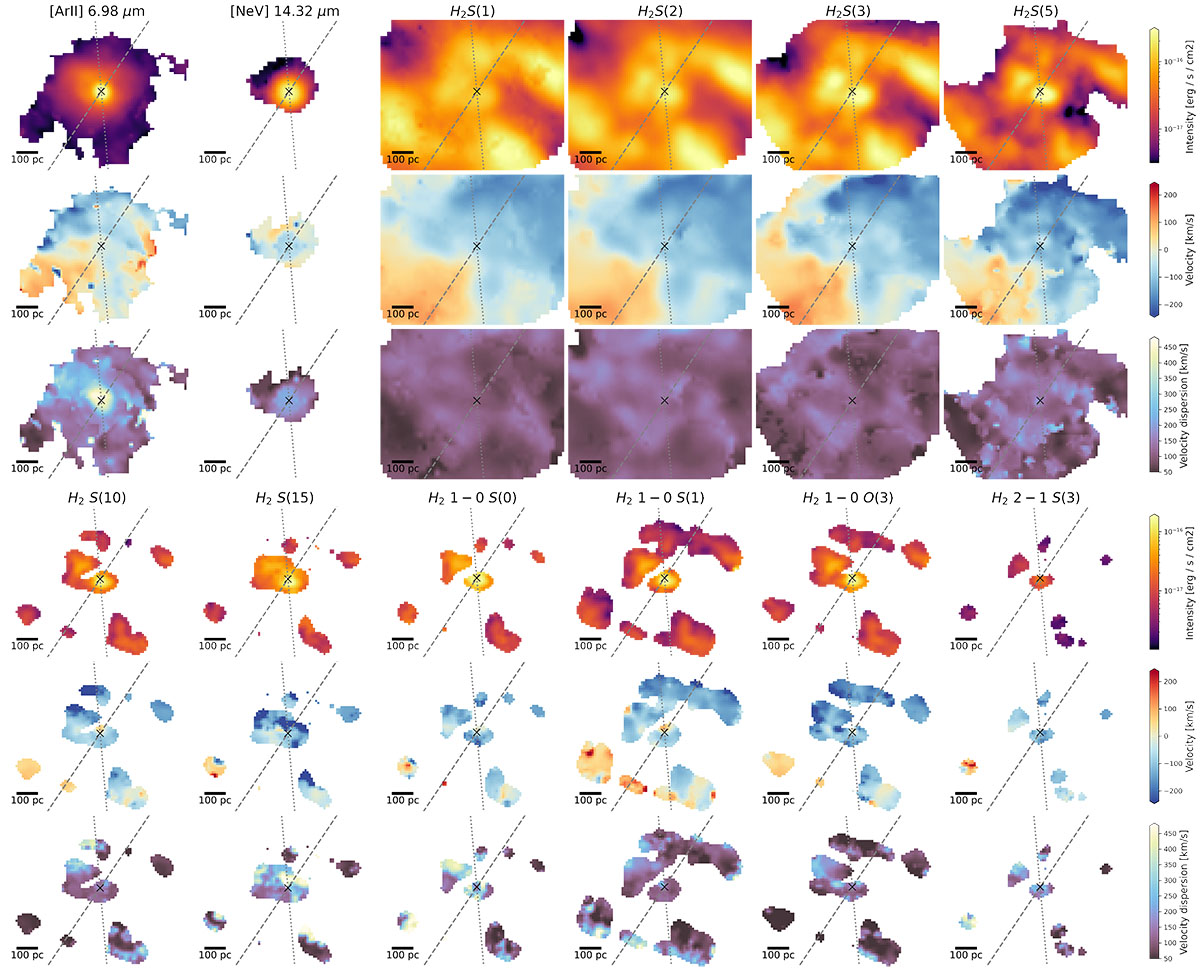
Moment maps showing H2, low-ionization [Ar II], and high-ionization lines [Ne V]. Only pixels with detections above 5σ are shown. The dashed and dotted gray lines indicate the jet axis and the galaxy’s major axis, respectively. A black x marker indicates the AGN radio core.
Current usage metrics show cumulative count of Article Views (full-text article views including HTML views, PDF and ePub downloads, according to the available data) and Abstracts Views on Vision4Press platform.
Data correspond to usage on the plateform after 2015. The current usage metrics is available 48-96 hours after online publication and is updated daily on week days.
Initial download of the metrics may take a while.