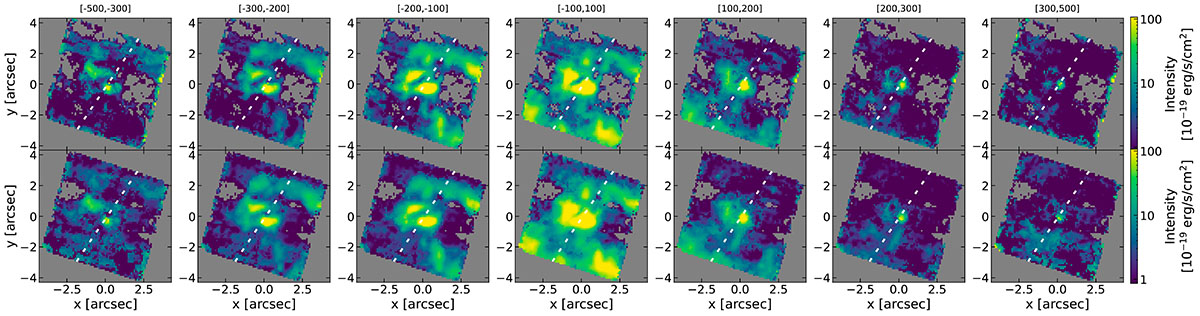
Fig. 4.
Download original image
NIRSpec channel maps, illustrating both rotational and rovibrational kinematics. Top row: H2 1–0 S(1); Bottom row: H2 S(9). Each column corresponds to a velocity bin (from –500 to +500 km s−1). A dashed white line represents the jet axis. Both transitions trace the dust lanes between –300 to +200 km s−1, compatible with rotation. The NE feature, strongest at –500 km s−1 and persisting to +200 km s−1, is identified as the forward shock front. The overall lack of alignment with the jet axis suggests the jet passes outside the disk plane.
Current usage metrics show cumulative count of Article Views (full-text article views including HTML views, PDF and ePub downloads, according to the available data) and Abstracts Views on Vision4Press platform.
Data correspond to usage on the plateform after 2015. The current usage metrics is available 48-96 hours after online publication and is updated daily on week days.
Initial download of the metrics may take a while.