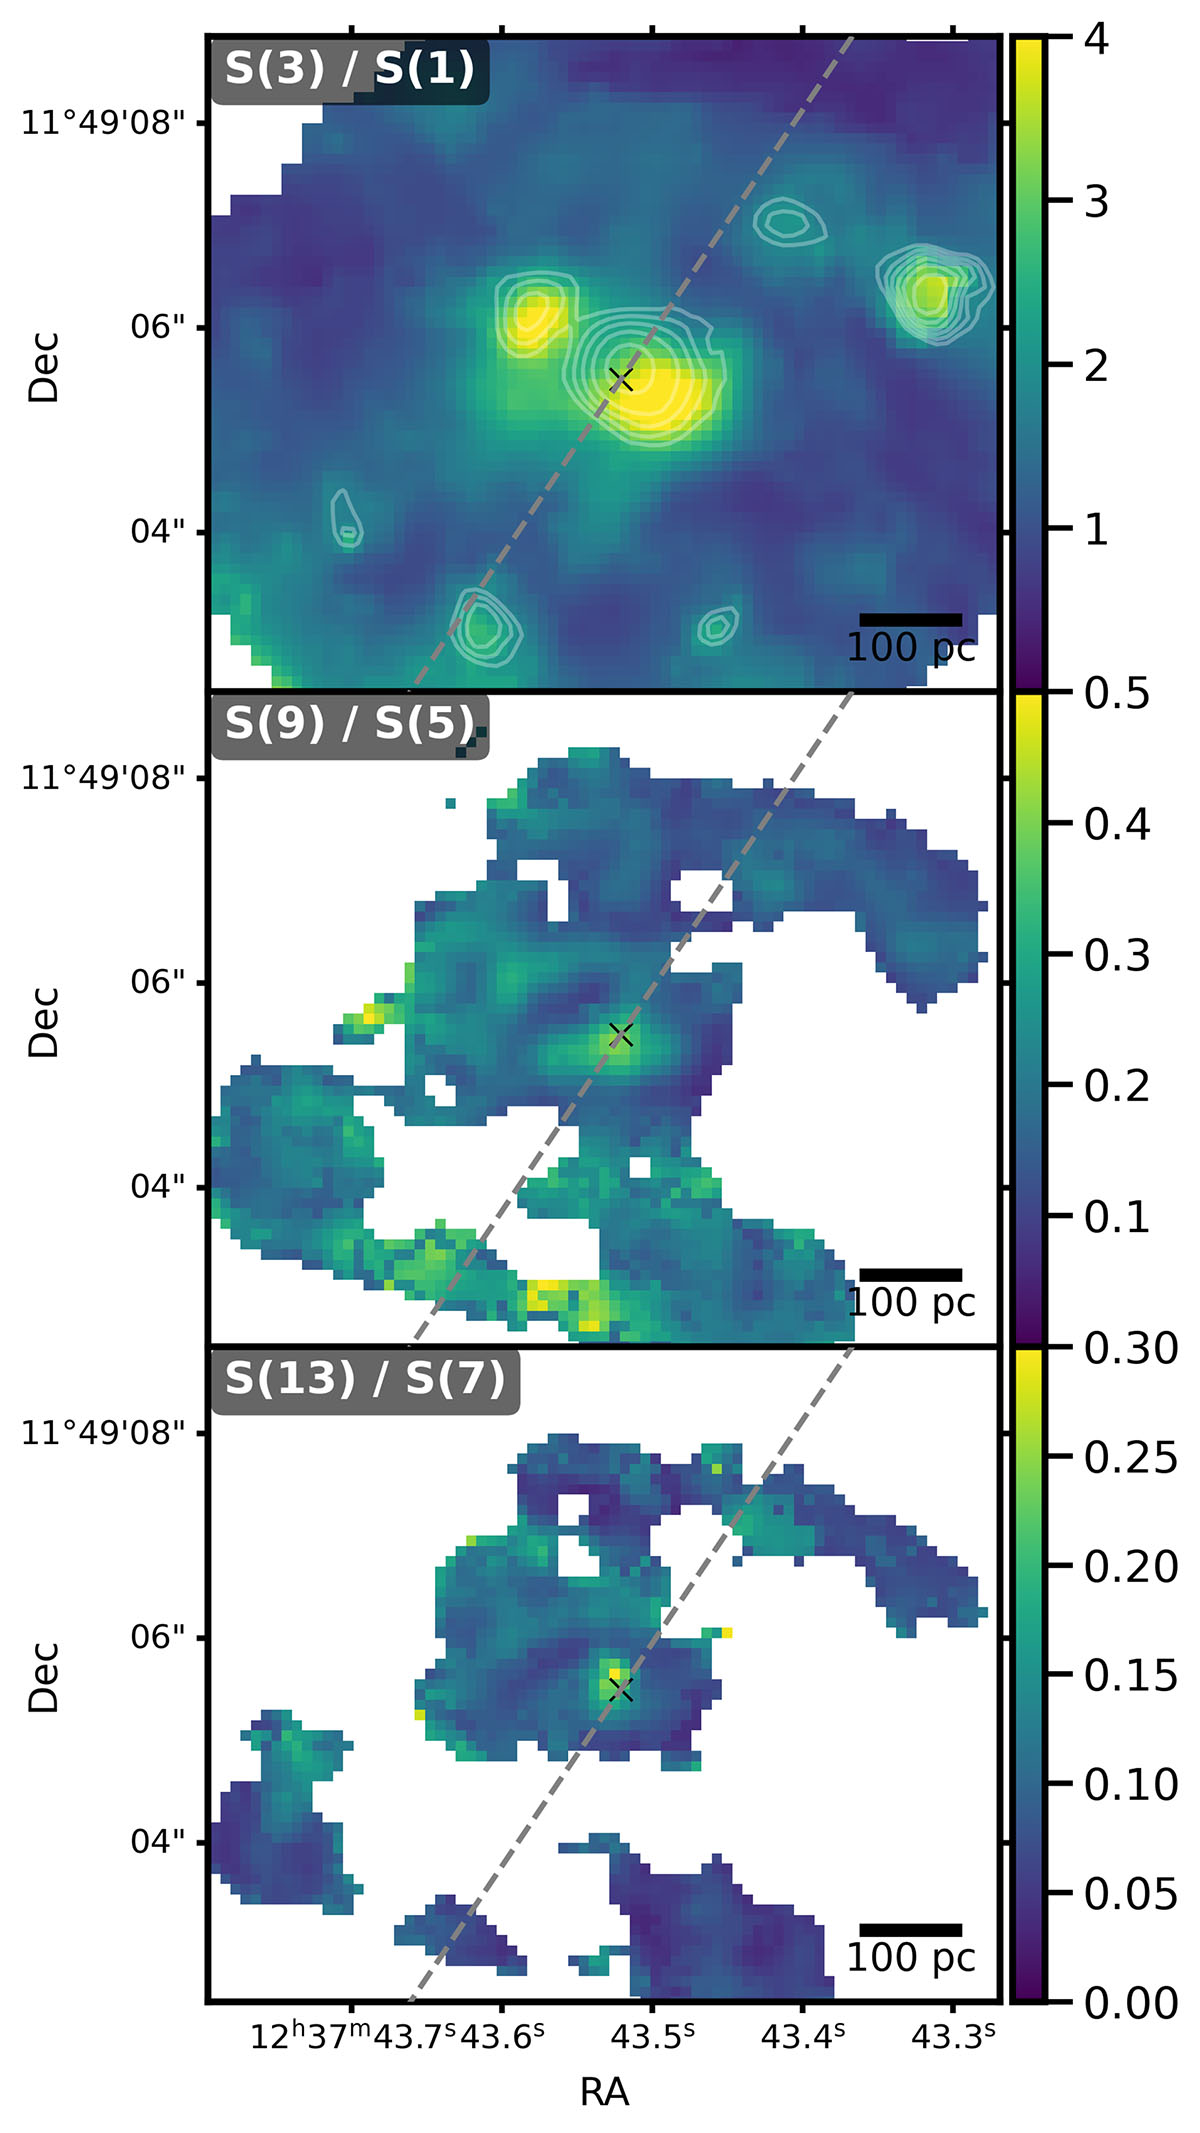
Fig. 5.
Download original image
Maps of pure H2 rotational line ratios. Top: S(3)/S(1) show elevated values in the dust lanes and in two-lobed structures near the AGN. White contours represent the OPR; the outermost contour corresponds to 3 (expected in LTE at T ≳ 200 K), with inner contours decreasing in steps of 0.25 down to 1.5. Middle: S(9)/S(5). Bottom: S(13)/S(7). These ratios reveal that the higher-J lines trace arc-like structures in both lobes. The dashed gray line indicates the jet axis.
Current usage metrics show cumulative count of Article Views (full-text article views including HTML views, PDF and ePub downloads, according to the available data) and Abstracts Views on Vision4Press platform.
Data correspond to usage on the plateform after 2015. The current usage metrics is available 48-96 hours after online publication and is updated daily on week days.
Initial download of the metrics may take a while.