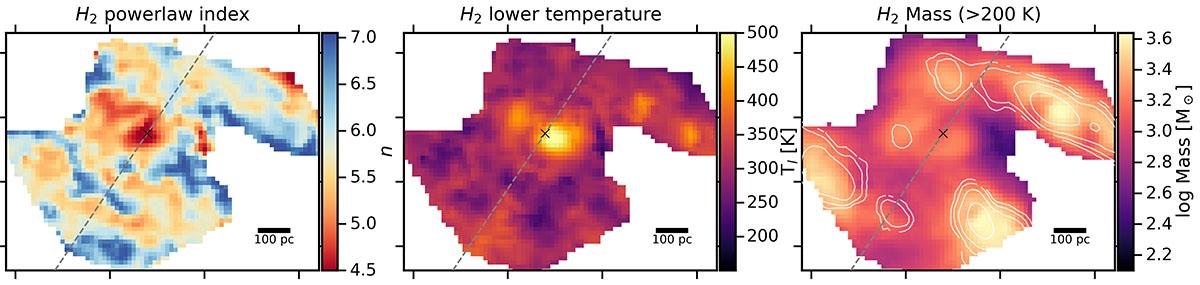
Fig. 7.
Download original image
Maps from the modified power-law temperature distribution model from Togi & Smith (2016). Left: Power-law index n, with lower values indicating a stronger contribution from hotter gas. Center: Lower temperature Tl, contributing to H2 emission. Right: Warm H2 mass per pixel, with each pixel area being ≈161 pc2. White contours trace CO(2–1) emission from cooler molecular gas. The dashed gray line marks the jet axis.
Current usage metrics show cumulative count of Article Views (full-text article views including HTML views, PDF and ePub downloads, according to the available data) and Abstracts Views on Vision4Press platform.
Data correspond to usage on the plateform after 2015. The current usage metrics is available 48-96 hours after online publication and is updated daily on week days.
Initial download of the metrics may take a while.