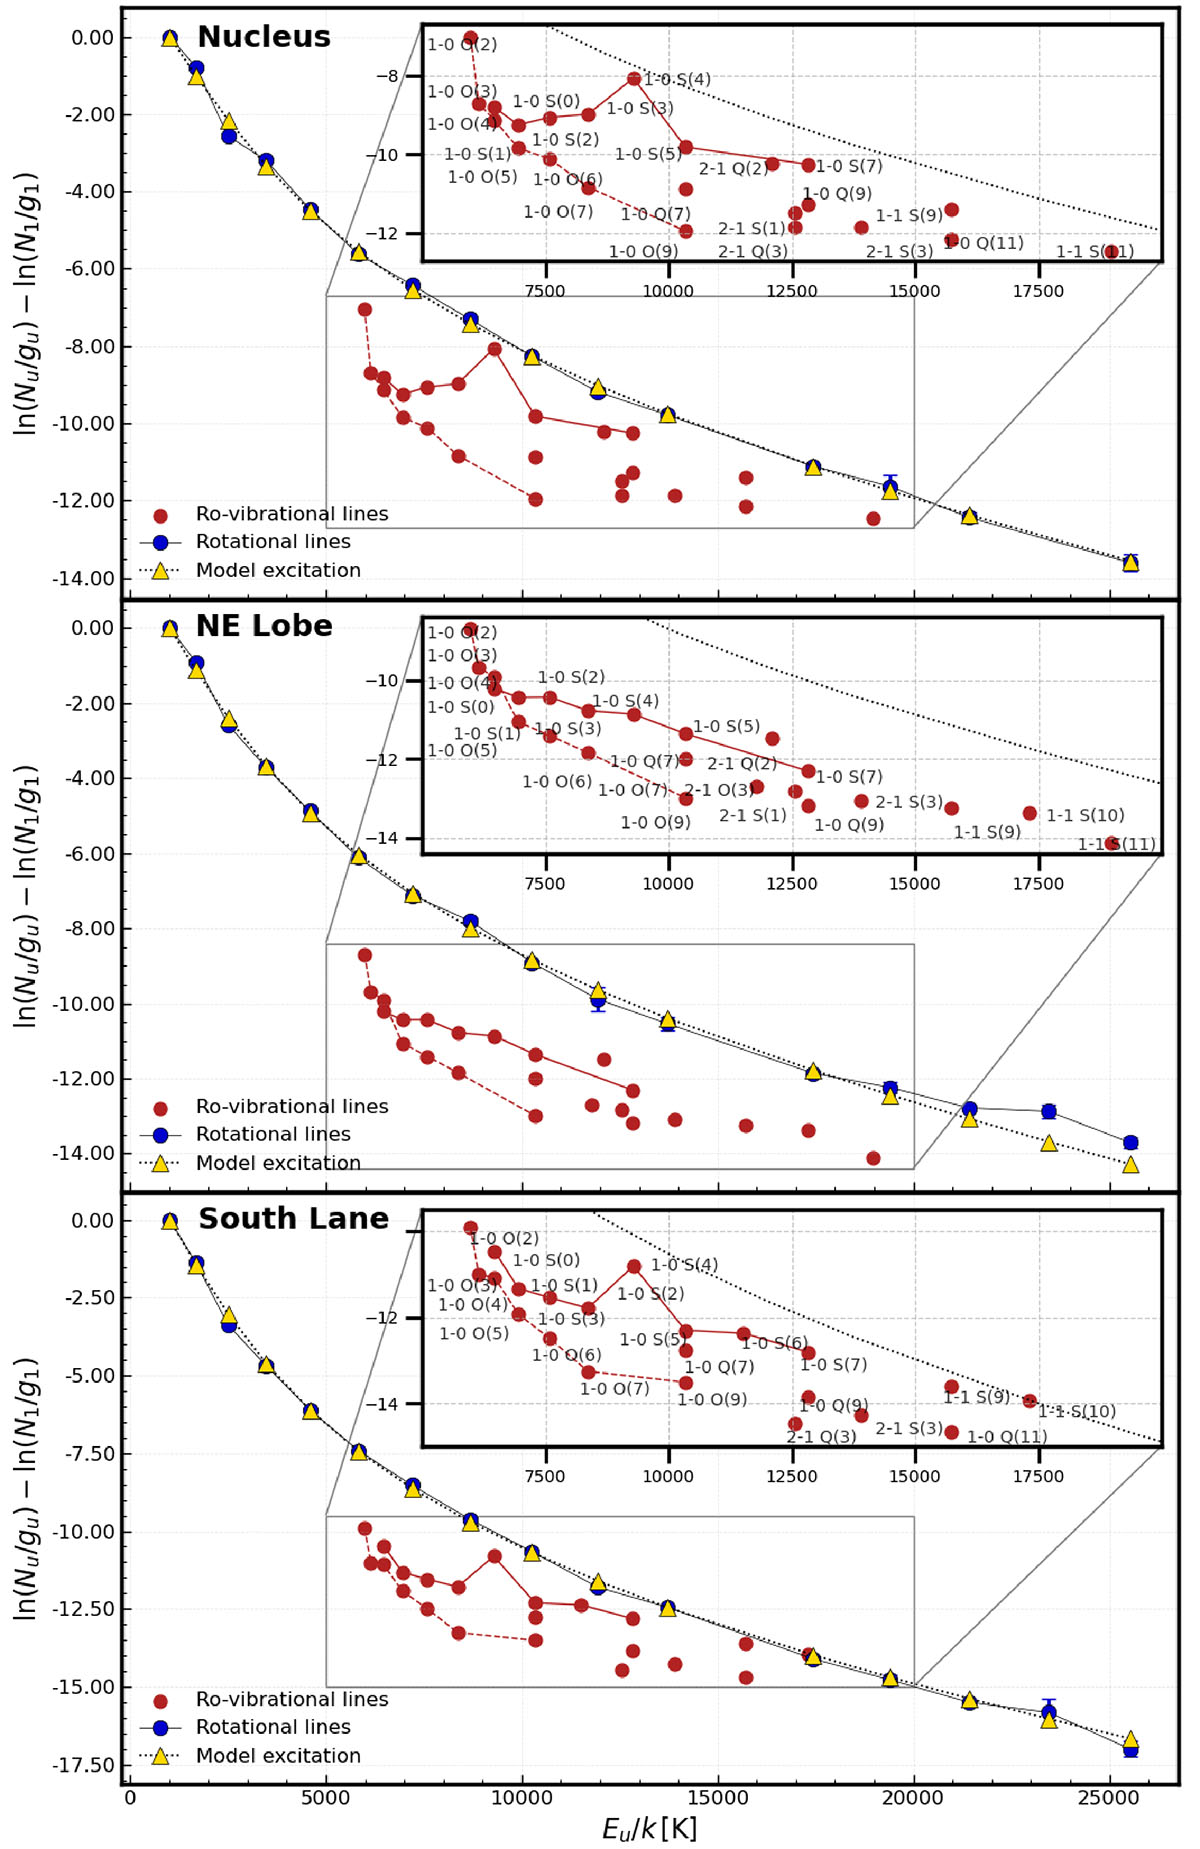
Fig. 8.
Download original image
H2 excitation ladders for selected regions. Top: Nucleus. Middle: Northeast shock. Bottom: South lane. Pure rotational H2 lines are shown in blue, with best-fit models in yellow triangles. Observed rovibrational lines are plotted in red, with zoomed-in insets displayed in the top corners of each panel. The solid line connects the 1–0 S(1–7) rovibrational ladder, while the dashed line connects the 1–0 O(2–9) ladder.
Current usage metrics show cumulative count of Article Views (full-text article views including HTML views, PDF and ePub downloads, according to the available data) and Abstracts Views on Vision4Press platform.
Data correspond to usage on the plateform after 2015. The current usage metrics is available 48-96 hours after online publication and is updated daily on week days.
Initial download of the metrics may take a while.