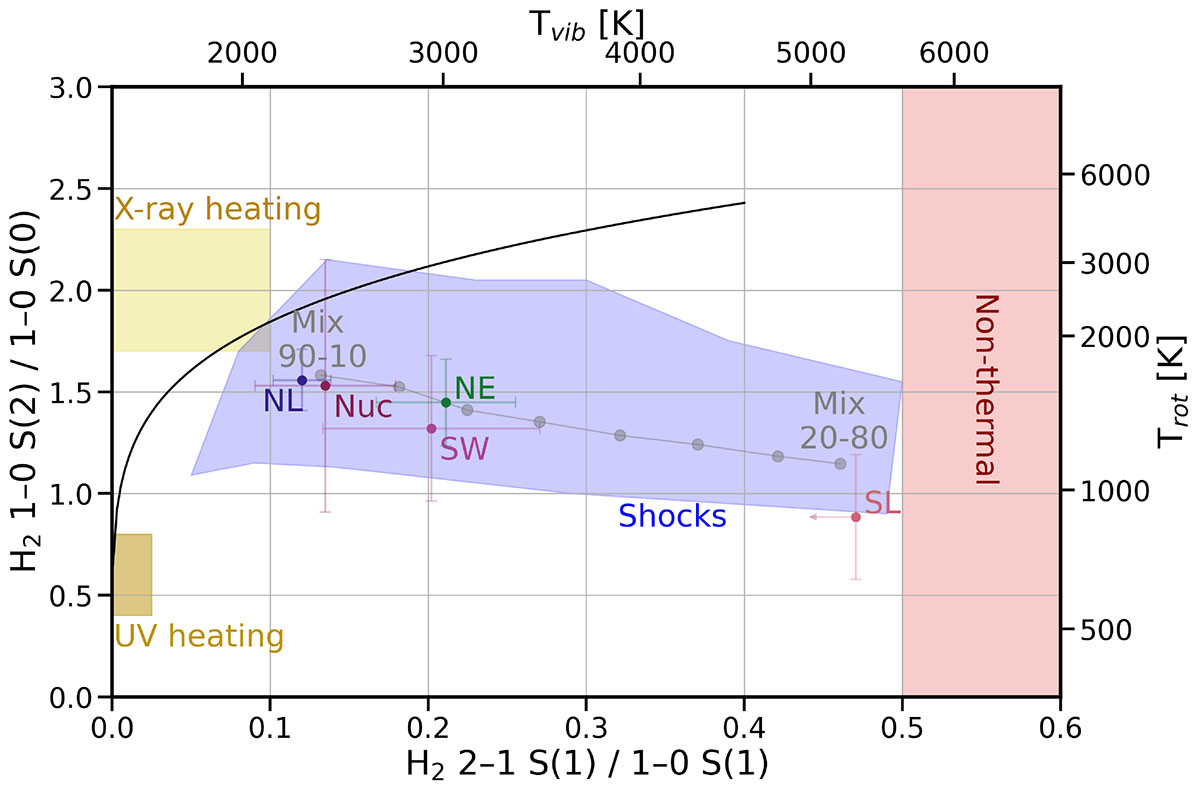
Fig. 9.
Download original image
H2 2–1 S(1)/1–0 S(1) vs. 1–0 S(2)/1–0 S(0) emission-line ratios for selected regions of M58. Colored markers indicate the nucleus (Nuc), north and south lane (NL-SL), and the northeast and southwest H2 lobes (NE-SW). The solid black curve marks the predicted trend for pure thermal excitation. Shaded regions represent the domains of alternative excitation mechanisms: UV thermal excitation (Sternberg 1989), X-ray heating (Draine & Woods 1990), shocks (Kristensen et al. 2023), and nonthermal UV fluorescence (Black & van Dishoeck 1987). The gray curve shows mixed thermal and fluorescent excitation models, decreasing from 90% thermal (left) in 10% steps. The top and right axes indicate the vibrational and rotational temperatures (Tvib, Trot) respectively.
Current usage metrics show cumulative count of Article Views (full-text article views including HTML views, PDF and ePub downloads, according to the available data) and Abstracts Views on Vision4Press platform.
Data correspond to usage on the plateform after 2015. The current usage metrics is available 48-96 hours after online publication and is updated daily on week days.
Initial download of the metrics may take a while.