Fig. 1
Download original image
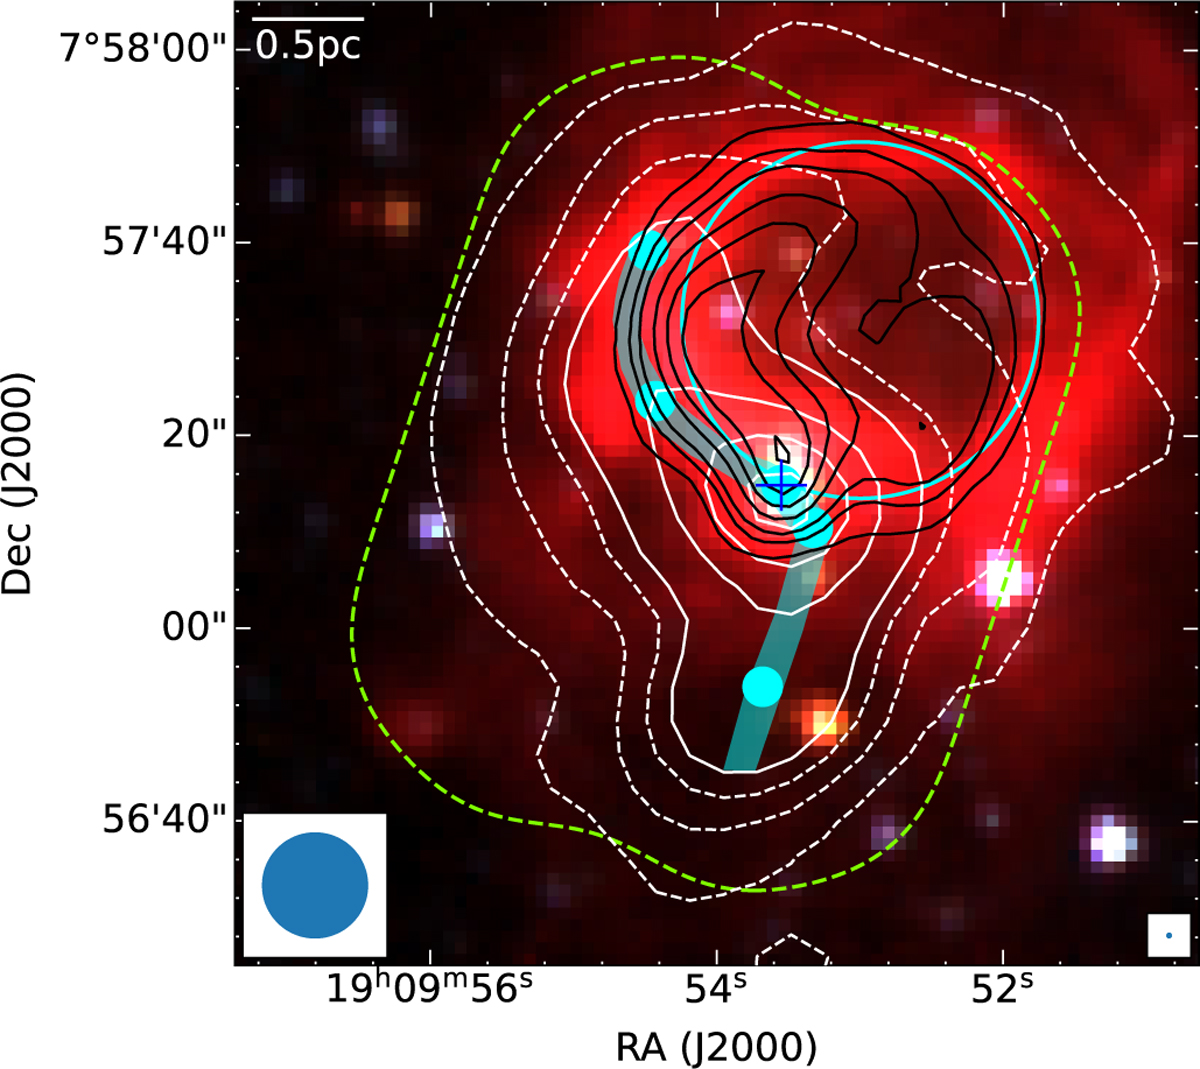
Spitzer three-color image of the I19074 region in the mid-infrared bands (blue: 3.6 μm, green: 4.5 μm, red: 8.0 μm). The white contours represent 1.2 mm dust continuum emission from the MAMBO survey (Beuther et al. 2002), while the black contours indicate 20 cm radio continuum emission from the EFFLSBRG survey (Winkel et al. 2016). Contour levels for the 20 cm radio emission (black) start at 5 σ20 cm(σ20 cm=0.2 mJy beam−1) and increase in steps of 5 σ20 cm. The 1.2 mm dust emission (white) is contoured at [3, 5, 7, 9, 15, 21, 27, 33] × σ1.2 mm, where σ1.2 mm=7 mJy beam−1. Cyan circles and blue plus mark the positions of identified compact sources and UC H II region by Lu et al. (2018). The cyan band outlines the S-shaped filament connecting the compact sources. The (synthesized) beams for the MAMBO (11′′ × 11′′) and ALMA (0.60′′ × 0.58′′) observations are shown in the lower-left and lower-right corners, respectively. The dashed loop shows the ALMA mosaic field. A scale bar of 0.5 pc is shown in the top right corner.
Current usage metrics show cumulative count of Article Views (full-text article views including HTML views, PDF and ePub downloads, according to the available data) and Abstracts Views on Vision4Press platform.
Data correspond to usage on the plateform after 2015. The current usage metrics is available 48-96 hours after online publication and is updated daily on week days.
Initial download of the metrics may take a while.