Fig. D
Download original image
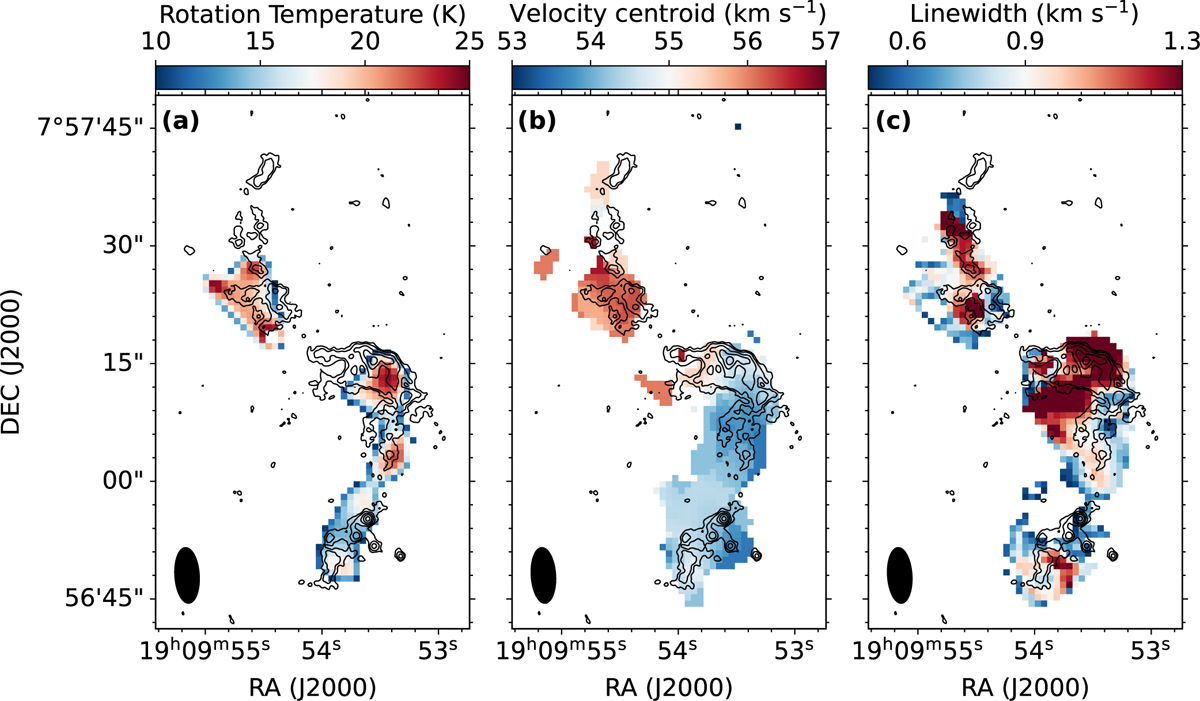
Parameter maps derived from VLA NH3 (1-1) observations at 22 GHz, overlaid with contours of ALMA 1.3 mm continuum emission. Panel a: Rotation temperature map. Panel b: Mean velocity (moment 1) map. Panel c: line width map. The VLA beam size is shown at the bottom left. In each panel, the black contours are [3, 5, 10, 20, 40, 80, 160] × σ1.3 mm(σ1.3 mm=0.1 mJy beam−1).
Current usage metrics show cumulative count of Article Views (full-text article views including HTML views, PDF and ePub downloads, according to the available data) and Abstracts Views on Vision4Press platform.
Data correspond to usage on the plateform after 2015. The current usage metrics is available 48-96 hours after online publication and is updated daily on week days.
Initial download of the metrics may take a while.