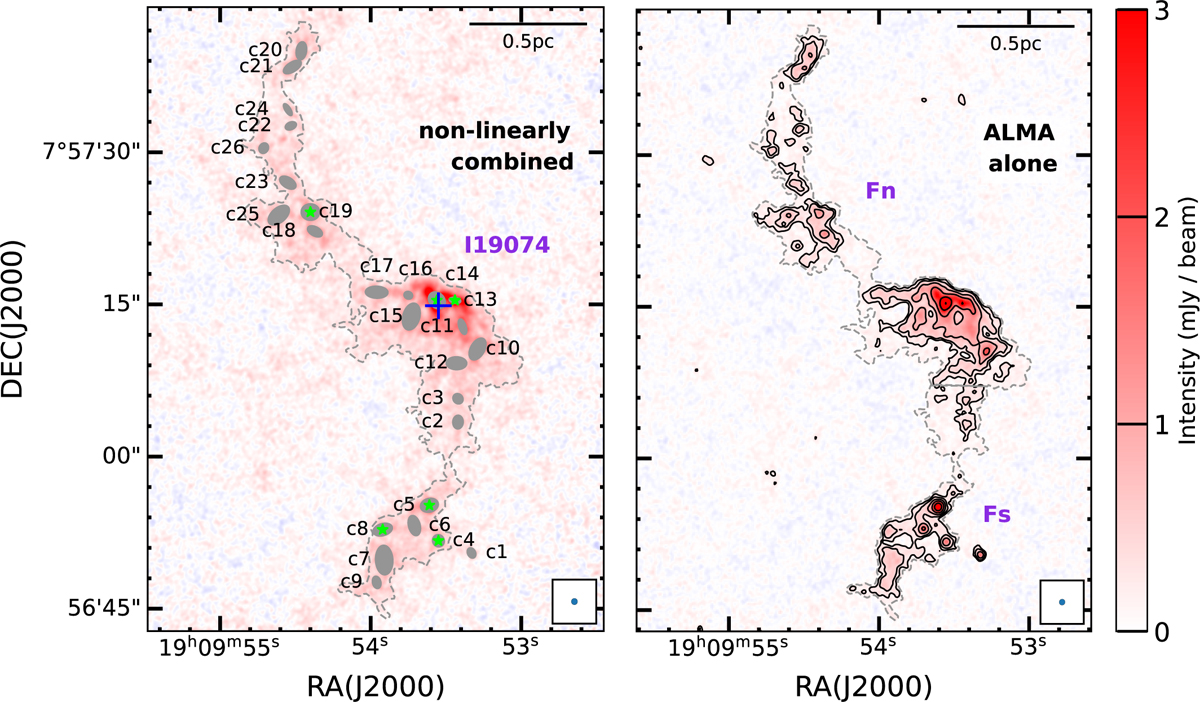
Fig. 2
Download original image
Left: Combined ALMA 1.3 mm continuum map of I19074 with 26 cores overlaid (gray ellipses). The gray dashed contour marks the 2 σ1.3 mm boundary. Protostellar cores are marked as green stars. Right: ALMA-alone 1.3 mm continuum map with black contours ([3, 5, 10, 20, 40, 80, and 160] × σ1.3 mm, σ1.3 mm=0.08 mJy beam−1). Hierarchical structures Fn and Fs are bounded by the gray dashed contour at the 2 σ1.3 mm level. Blue plus marks the position of identified UC H II region by Lu et al. (2018). The synthesized beam and 0.5 pc scale bar are shown in right corners.
Current usage metrics show cumulative count of Article Views (full-text article views including HTML views, PDF and ePub downloads, according to the available data) and Abstracts Views on Vision4Press platform.
Data correspond to usage on the plateform after 2015. The current usage metrics is available 48-96 hours after online publication and is updated daily on week days.
Initial download of the metrics may take a while.