Fig. 3
Download original image
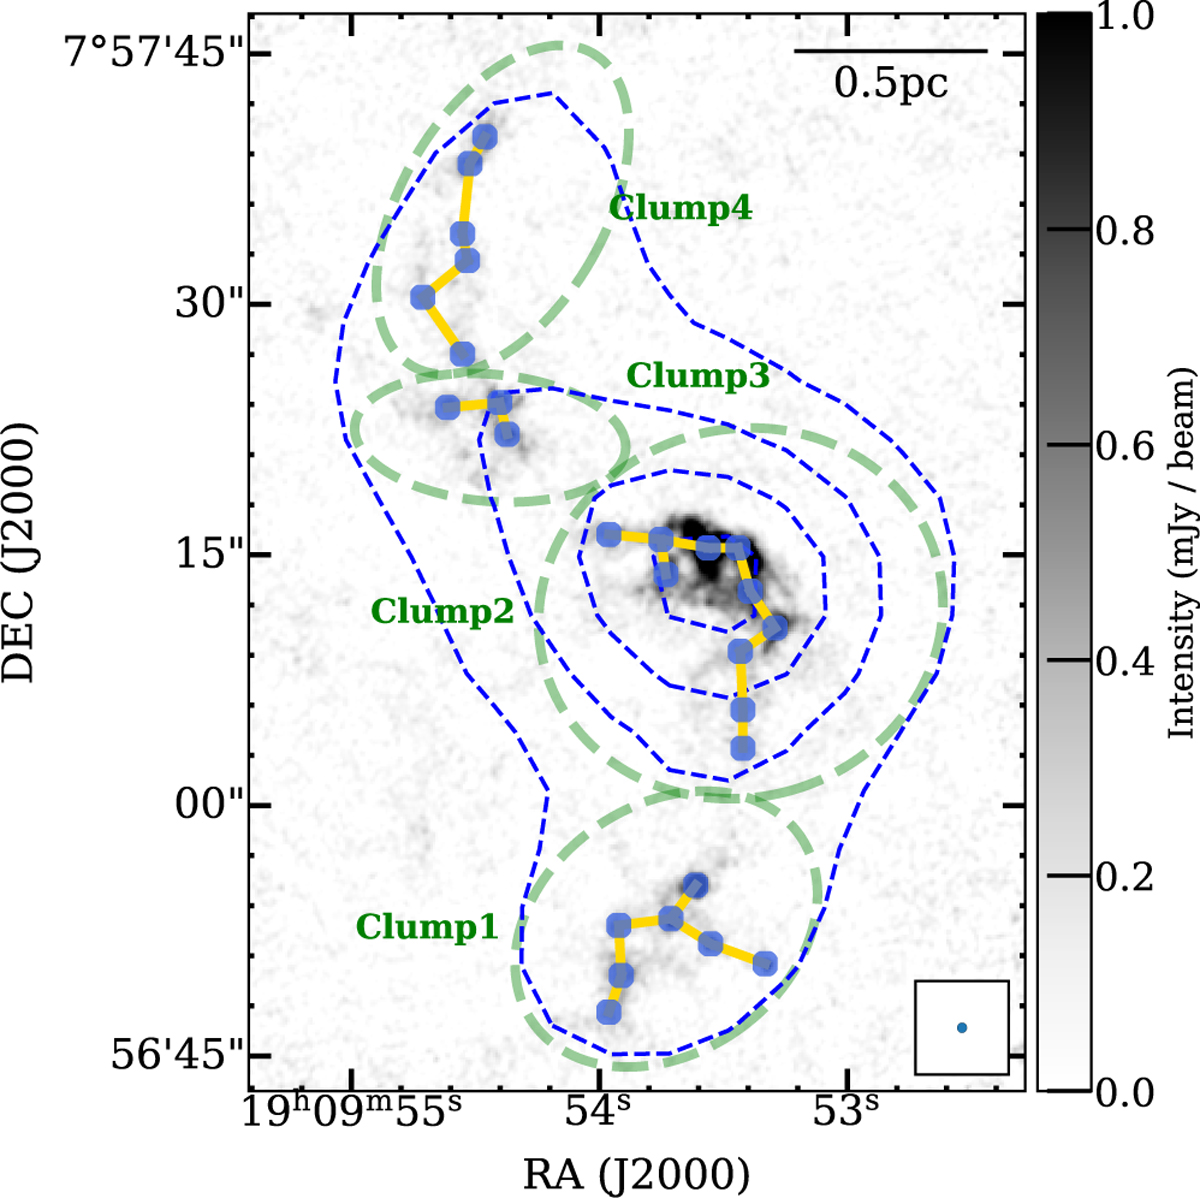
Spatial distribution of dense cores in I19074. The background shows ALMA 1.3 mm continuum emission. Blue dots mark core locations and the yellow solid line denotes the minimum path connecting these elements, given by the MST algorithm. The green dashed ellipses indicate clumps. The blue dashed contours are at [9, 15, 21, 27, and 33]× σ1.2 mm. The synthetic beam of 0.60′′ × 0.58′′ for ALMA observations and the scale bar of 0.5 pc are shown in right corners.
Current usage metrics show cumulative count of Article Views (full-text article views including HTML views, PDF and ePub downloads, according to the available data) and Abstracts Views on Vision4Press platform.
Data correspond to usage on the plateform after 2015. The current usage metrics is available 48-96 hours after online publication and is updated daily on week days.
Initial download of the metrics may take a while.