Fig. A
Download original image
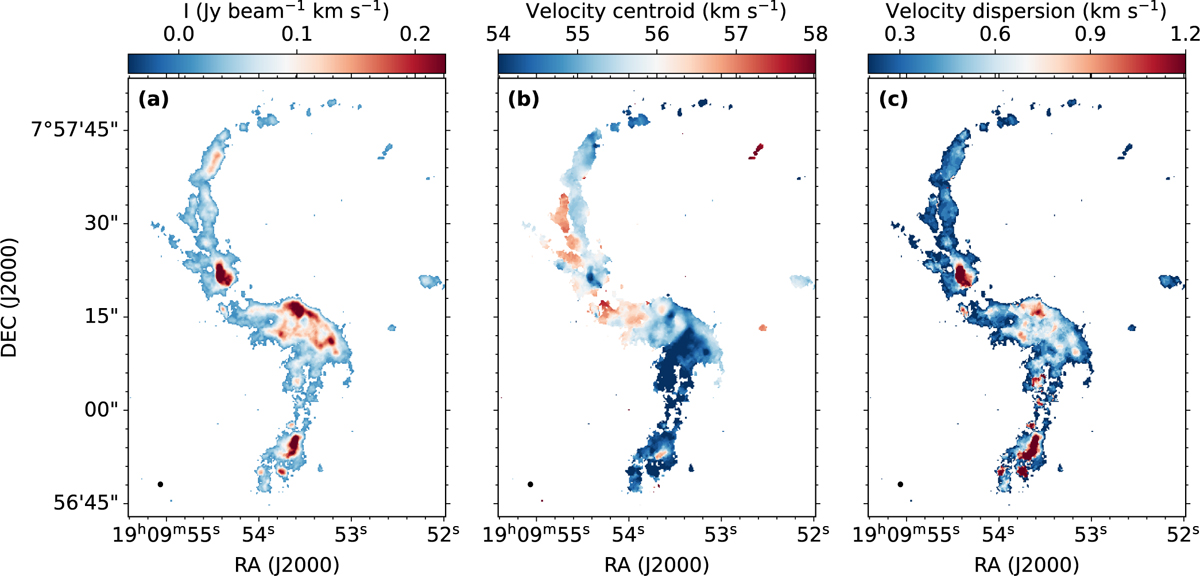
Moment maps of H2 CO(30,3−20,2). Panel a: Velocity-integrated intensity (moment 0) map over [50, 60] km s−1. Panel b: Mean velocity (moment 1) map. Panel c: Velocity dispersion (moment 2) map. The ALMA beam size is shown at the bottom left. Note that for all panels, only effective emission above 3 σH2CO(σH2CO=0.004 Jy beam−1) is visualized.
Current usage metrics show cumulative count of Article Views (full-text article views including HTML views, PDF and ePub downloads, according to the available data) and Abstracts Views on Vision4Press platform.
Data correspond to usage on the plateform after 2015. The current usage metrics is available 48-96 hours after online publication and is updated daily on week days.
Initial download of the metrics may take a while.