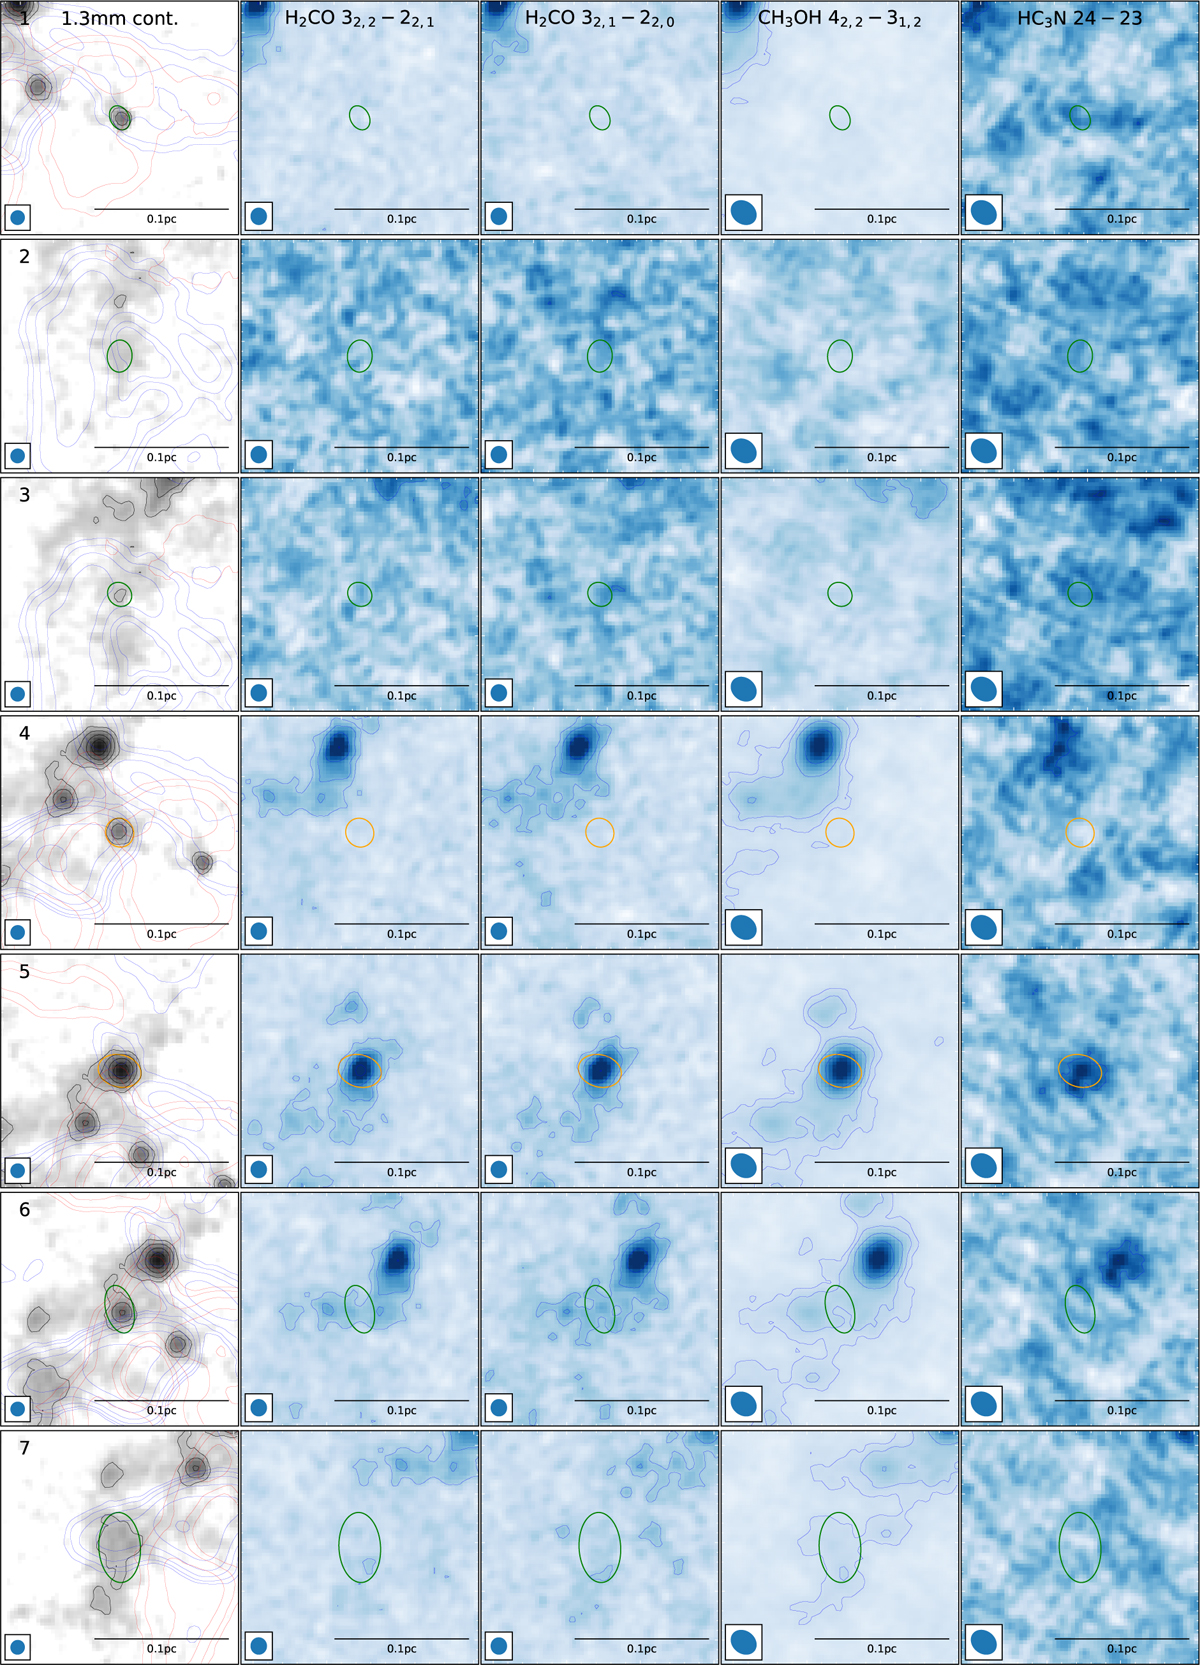
Fig. C1
Download original image
Figure for cores 1-7 showing evolutionary stage classification (prestellar: green; protostellar: orange) based on outflow and warm gas tracers. Left column displays 1.3 mm continuum (grayscale with black contours at 1.3 × 10⁻⁴ Jy beam−1 km s−1 ×(5, 10, 20, 40, 80, 160) overlaid with CO (2-1) outflow maps (blue/red contours at 0.045 Jy° beam km s−1 ×(5, 10, 20, 40, 80, 160), integrated over 5 to 15 kms from systemic velocity; arrows indicate flow direction). Columns 2-5 show integrated intensity maps of molecular line tracers (5 km s−1 integration width) with contour levels σline ×(5, 10, 20, 40, 80). In all panels the core is indicated by one ellipse, with green color indicating prestellar, orange indicating protostellar.
Current usage metrics show cumulative count of Article Views (full-text article views including HTML views, PDF and ePub downloads, according to the available data) and Abstracts Views on Vision4Press platform.
Data correspond to usage on the plateform after 2015. The current usage metrics is available 48-96 hours after online publication and is updated daily on week days.
Initial download of the metrics may take a while.