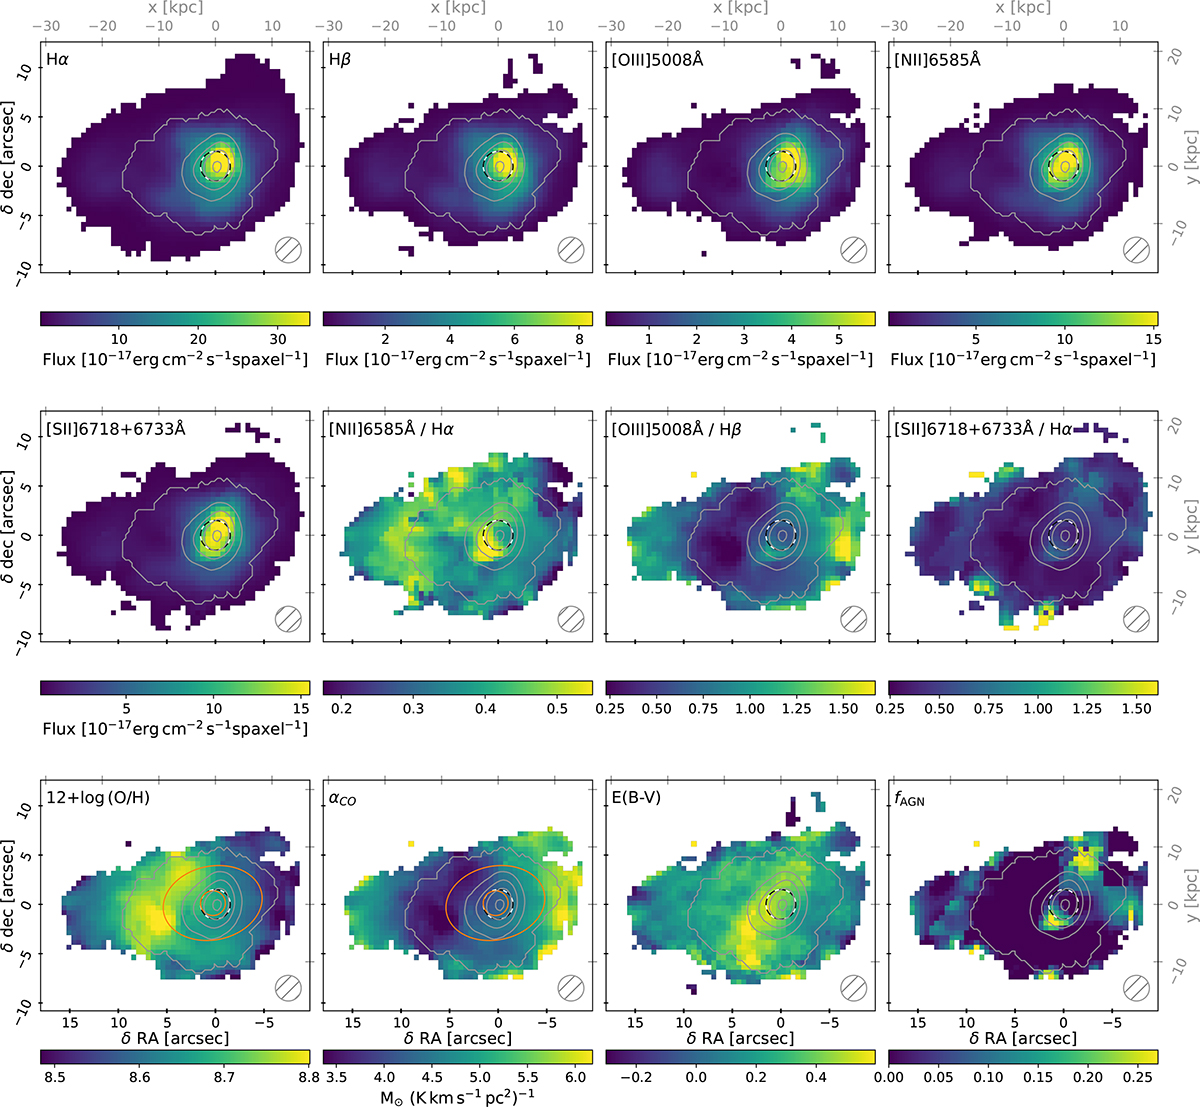
Fig. B.1.
Download original image
Maps obtained from the MaNGA data fitted by a double-Gaussian procedure. NOEMA CO(1–0) intensity contours are over-plotted in grey. The 3″ SDSS fibre is over-plotted in a dashed black circle. The elliptical aperture used to compute gas-phase metallicity is over-plotted in orange on the gas-phase metallicity map and the conversion factor map (see text).
Current usage metrics show cumulative count of Article Views (full-text article views including HTML views, PDF and ePub downloads, according to the available data) and Abstracts Views on Vision4Press platform.
Data correspond to usage on the plateform after 2015. The current usage metrics is available 48-96 hours after online publication and is updated daily on week days.
Initial download of the metrics may take a while.