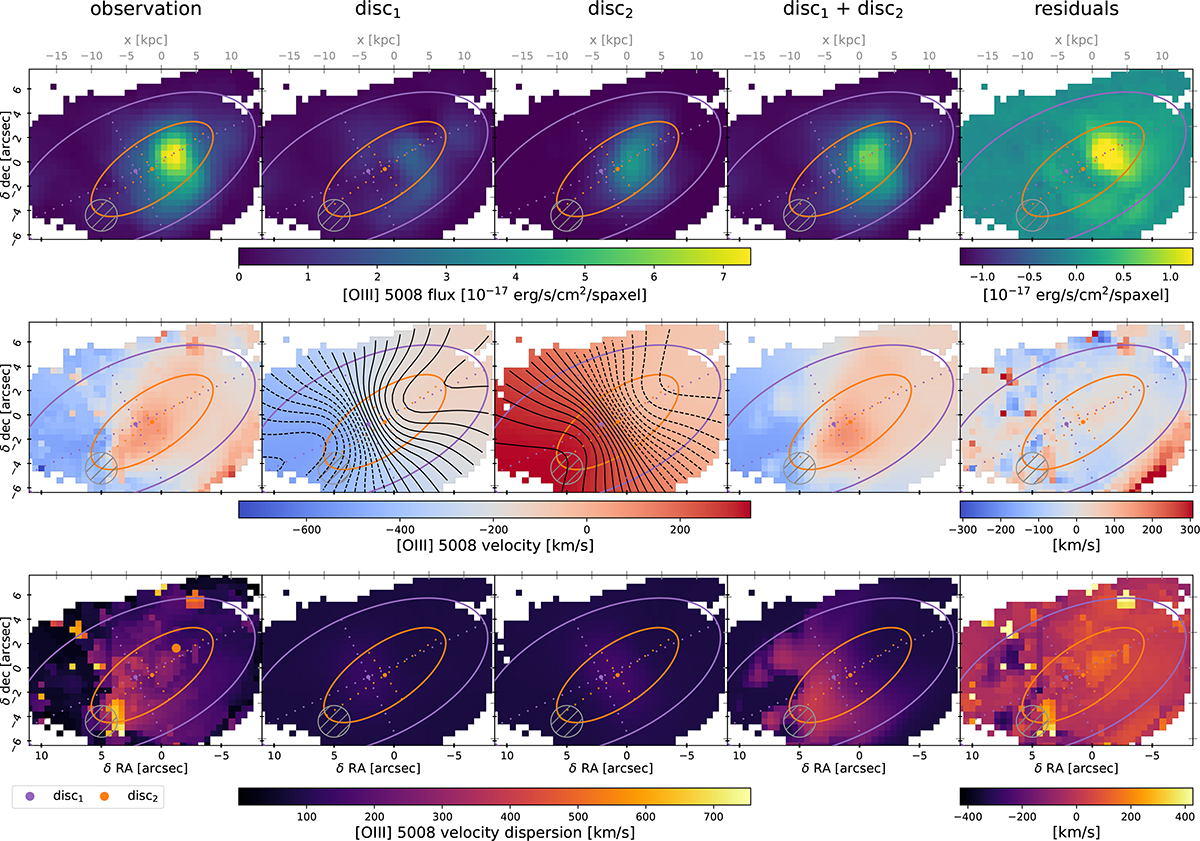
Fig. D.2.
Download original image
Observations, models and residuals of intensity, velocity and velocity dispersion from the [OIII] 5008 Å line. Models are shown both for each disc (column 2 and 3) and for the two superposed discs (column 4). Residuals are the observations (column 1) minus the two superposed discs (column 4). On the velocity maps of individual discs, iso-line-of-sight velocity curves are represented in black dashed (resp. solid) lines for values below (resp. above) the systemic velocity of the disc.
Current usage metrics show cumulative count of Article Views (full-text article views including HTML views, PDF and ePub downloads, according to the available data) and Abstracts Views on Vision4Press platform.
Data correspond to usage on the plateform after 2015. The current usage metrics is available 48-96 hours after online publication and is updated daily on week days.
Initial download of the metrics may take a while.