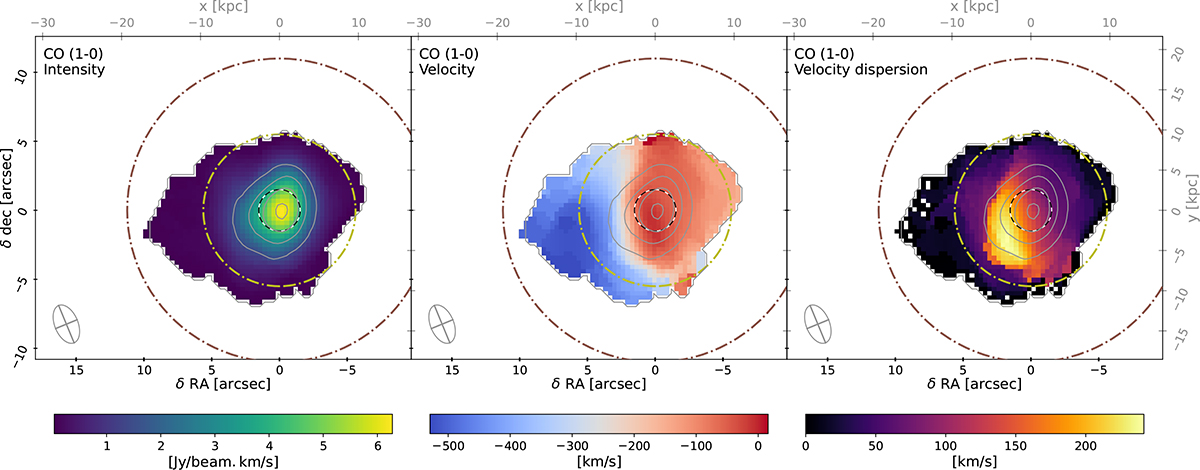
Fig. 2.
Download original image
Intensity, velocity, and velocity dispersion obtained for CO(1–0) NOEMA observations. A flux-density threshold of 1 mJy/beam is applied. We over-plot linearly spaced contours of the CO(1–0) intensity on each map. The NOEMA elliptical, Gaussian synthesised beam is represented in the bottom left corners of the panels. The IRAM 30 m CO(1–0) and CO(2–1) beams are shown in brown and yellow, respectively. The 3″ SDSS fibre is over-plotted with a dashed black circle.
Current usage metrics show cumulative count of Article Views (full-text article views including HTML views, PDF and ePub downloads, according to the available data) and Abstracts Views on Vision4Press platform.
Data correspond to usage on the plateform after 2015. The current usage metrics is available 48-96 hours after online publication and is updated daily on week days.
Initial download of the metrics may take a while.