Fig. 5.
Download original image
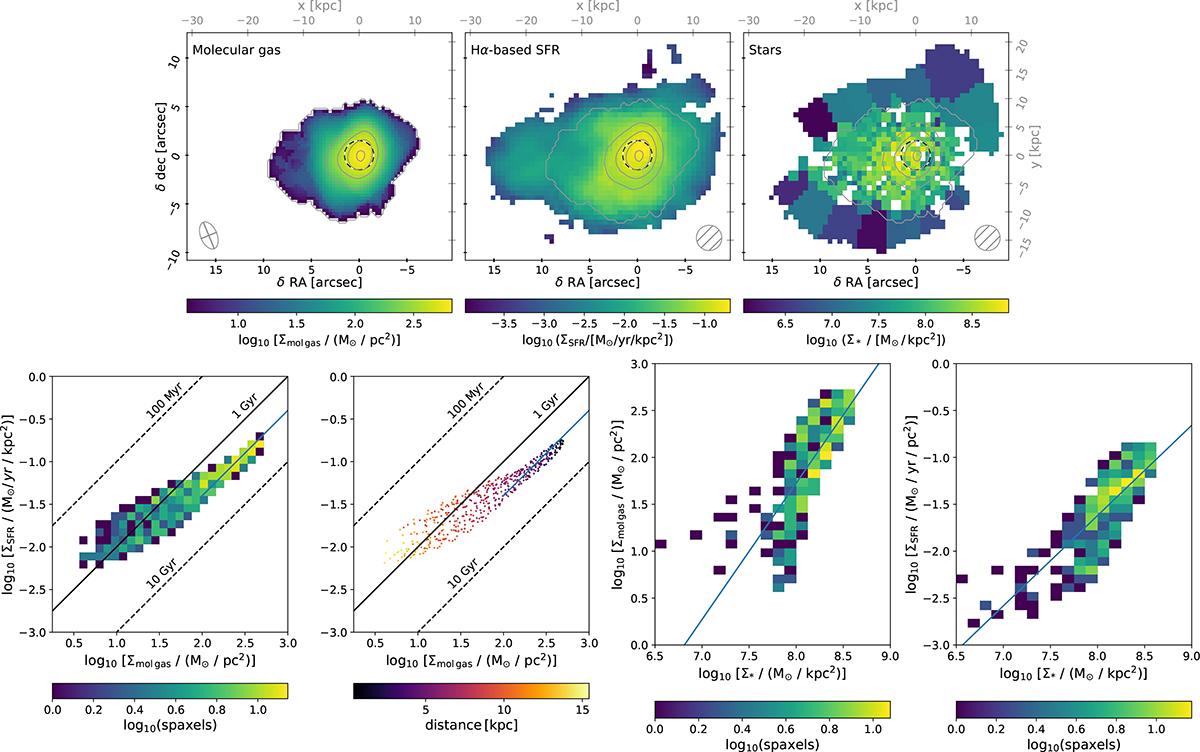
Top row: molecular-gas surface density (left), Hα-based SFR surface density (middle) and stellar surface density (right). CO(1–0) intensity contours are over-plotted in grey. The 3″ SDSS fibre is over-plotted with a dashed black circle. Bottom row: diagrams obtained after degrading the maps to the same spatial resolution (see text). From left to right: KS diagram with 2D bins colour-coded by the number of contributing MaNGA spaxels; KS diagram with one dot per MaNGA spaxel, colour-coded by its distance to the centre of the SDSS fibre; molecular-gas surface density versus stellar surface density; and SFR surface density versus stellar surface density. In the two KS diagrams, locations of constant depletion times are shown as diagonal black lines, and as a diagonal blue line for the average depletion time of high-density molecular gas.
Current usage metrics show cumulative count of Article Views (full-text article views including HTML views, PDF and ePub downloads, according to the available data) and Abstracts Views on Vision4Press platform.
Data correspond to usage on the plateform after 2015. The current usage metrics is available 48-96 hours after online publication and is updated daily on week days.
Initial download of the metrics may take a while.