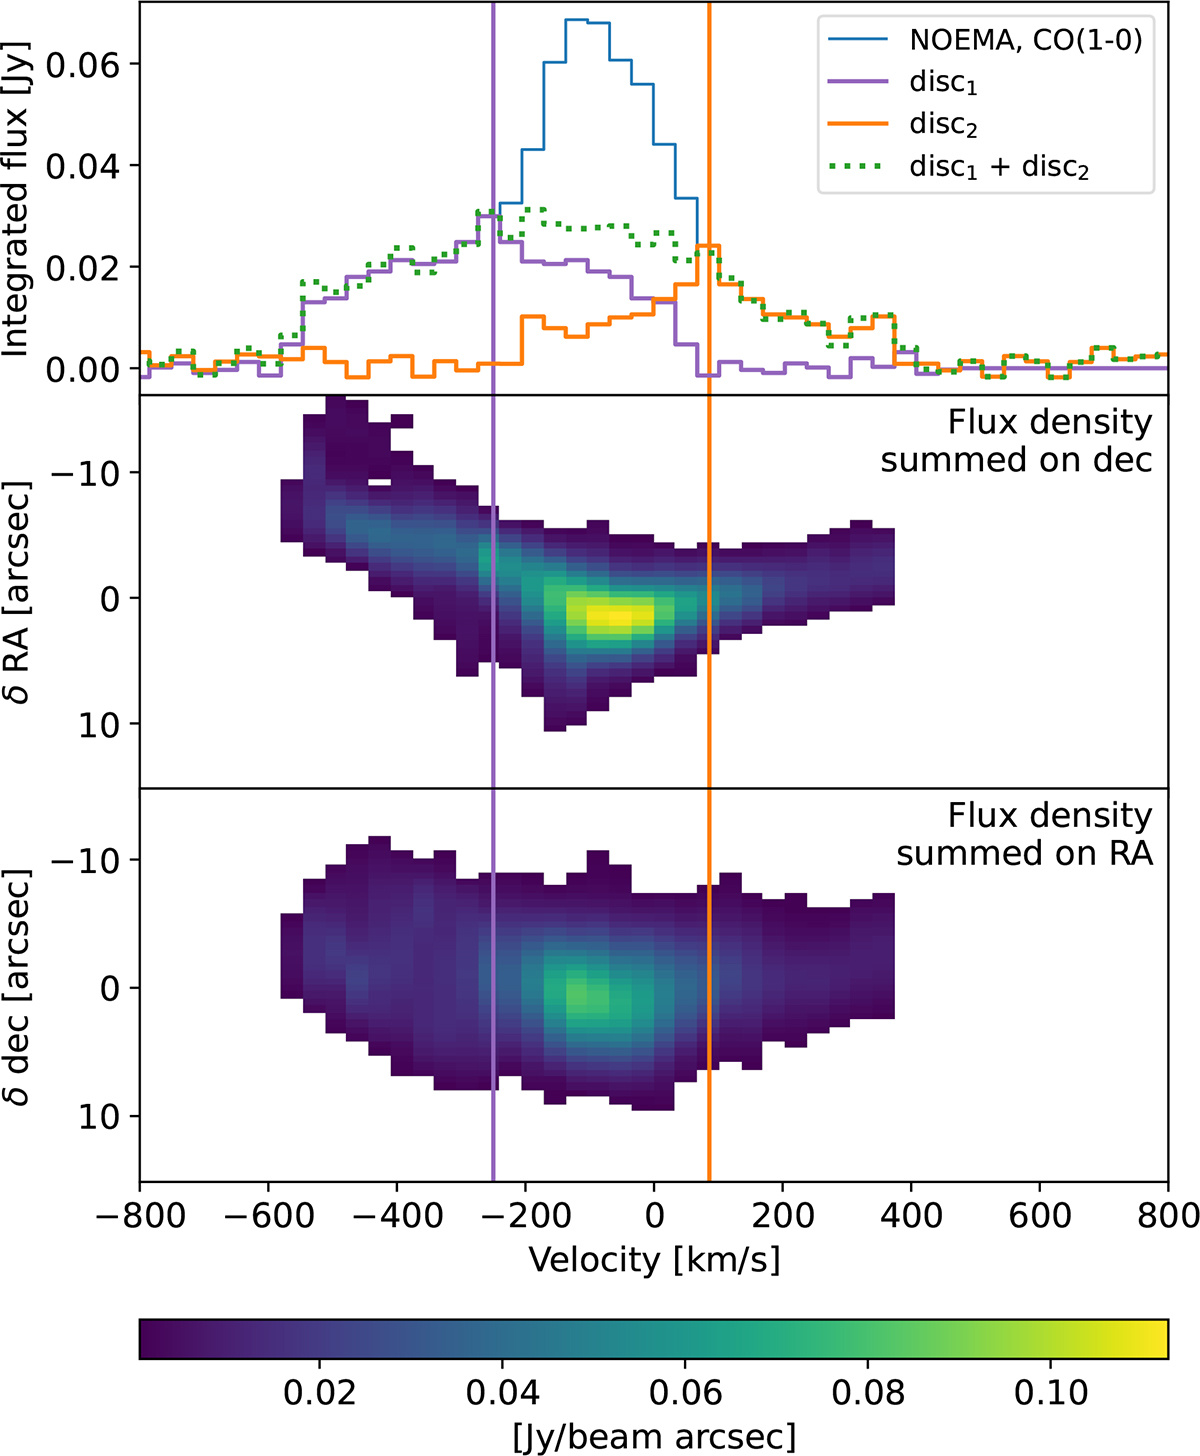
Fig. 7.
Download original image
Attempt to reconstruct the observed spectrum, assuming there are two discs, that each one has a half part accounting for the CO(1–0) emission at the lowest or highest observed velocities, and that the CO(1–0) emission of each disc is symmetric with regard to its minor kinematic axis. The violet (resp. orange) line is an example of systemic velocity for the first (resp. second) disc, with the spectrum of the disc in the same colour in the top panel. Top: NOEMA spectrum; discs’ spectra reconstructed by symmetry and their sum. Middle: NOEMA cube integrated on declination. Bottom: NOEMA cube integrated on RA.
Current usage metrics show cumulative count of Article Views (full-text article views including HTML views, PDF and ePub downloads, according to the available data) and Abstracts Views on Vision4Press platform.
Data correspond to usage on the plateform after 2015. The current usage metrics is available 48-96 hours after online publication and is updated daily on week days.
Initial download of the metrics may take a while.