Fig. 8.
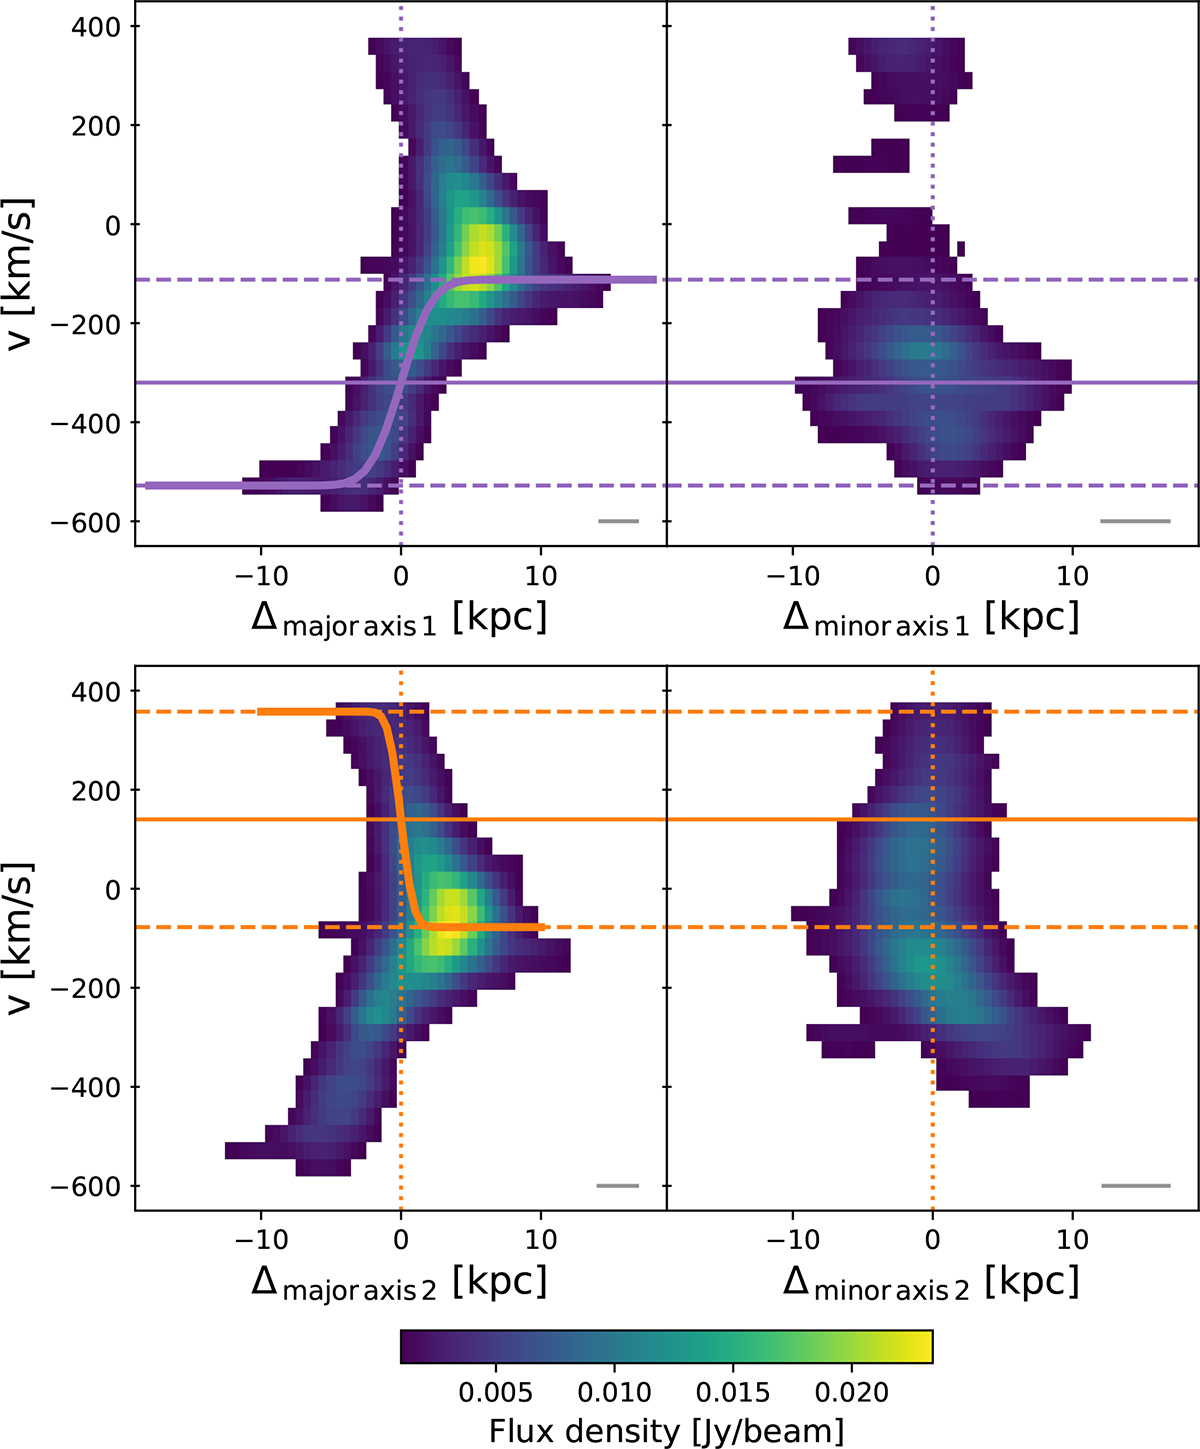
Download original image
Position–velocity diagrams of NOEMA observations centred on estimated kinematic centre of disc1 (first row) or on the estimated kinematic centre of disc2 (second row) and computed on a one-spatial-pixel-wide slice either along the major axes (first column) or the minor axes (second column) of discs. vc(R)sin(i) curves are represented on diagrams with position taken along the major axis (first column). Horizontal solid lines show the fitted systemic velocities, vsys, of the discs, and horizontal dashed lines show vsys ± Vmaxsin(i). Violet lines correspond to disc1 and orange curves to disc2. The horizontal grey lines in the bottom right corner of each panel show the projection of the elliptical Gaussian NOEMA synthesised beam on the x-axis of the panel.
Current usage metrics show cumulative count of Article Views (full-text article views including HTML views, PDF and ePub downloads, according to the available data) and Abstracts Views on Vision4Press platform.
Data correspond to usage on the plateform after 2015. The current usage metrics is available 48-96 hours after online publication and is updated daily on week days.
Initial download of the metrics may take a while.