Fig. 2.
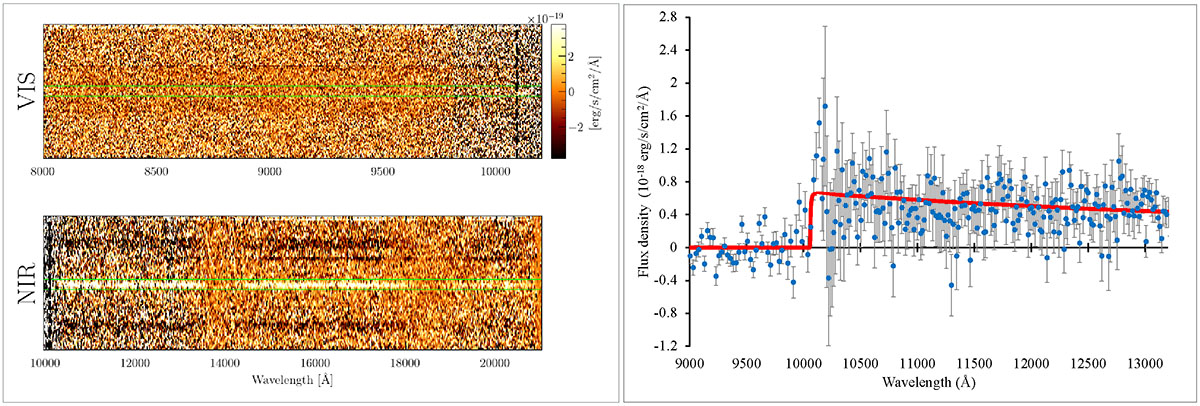
Download original image
Left: 2D VIS (top) and NIR (bottom) VLT/X-shooter spectra. The VIS spectrum is cut at 8000 Å, and the vertical dashed black line marks the position corresponding to the Ly-α observer frame wavelength at z ≃ 7.3. Right: 1D re-binned combined spectrum from 9000 to 13 000 Å. The solid red line shows the best fitting afterglow model (Appendix E). Note that the increased noise around the break location is an unfortunate consequence of it being close to the boundary between the VIS and NIR arms.
Current usage metrics show cumulative count of Article Views (full-text article views including HTML views, PDF and ePub downloads, according to the available data) and Abstracts Views on Vision4Press platform.
Data correspond to usage on the plateform after 2015. The current usage metrics is available 48-96 hours after online publication and is updated daily on week days.
Initial download of the metrics may take a while.