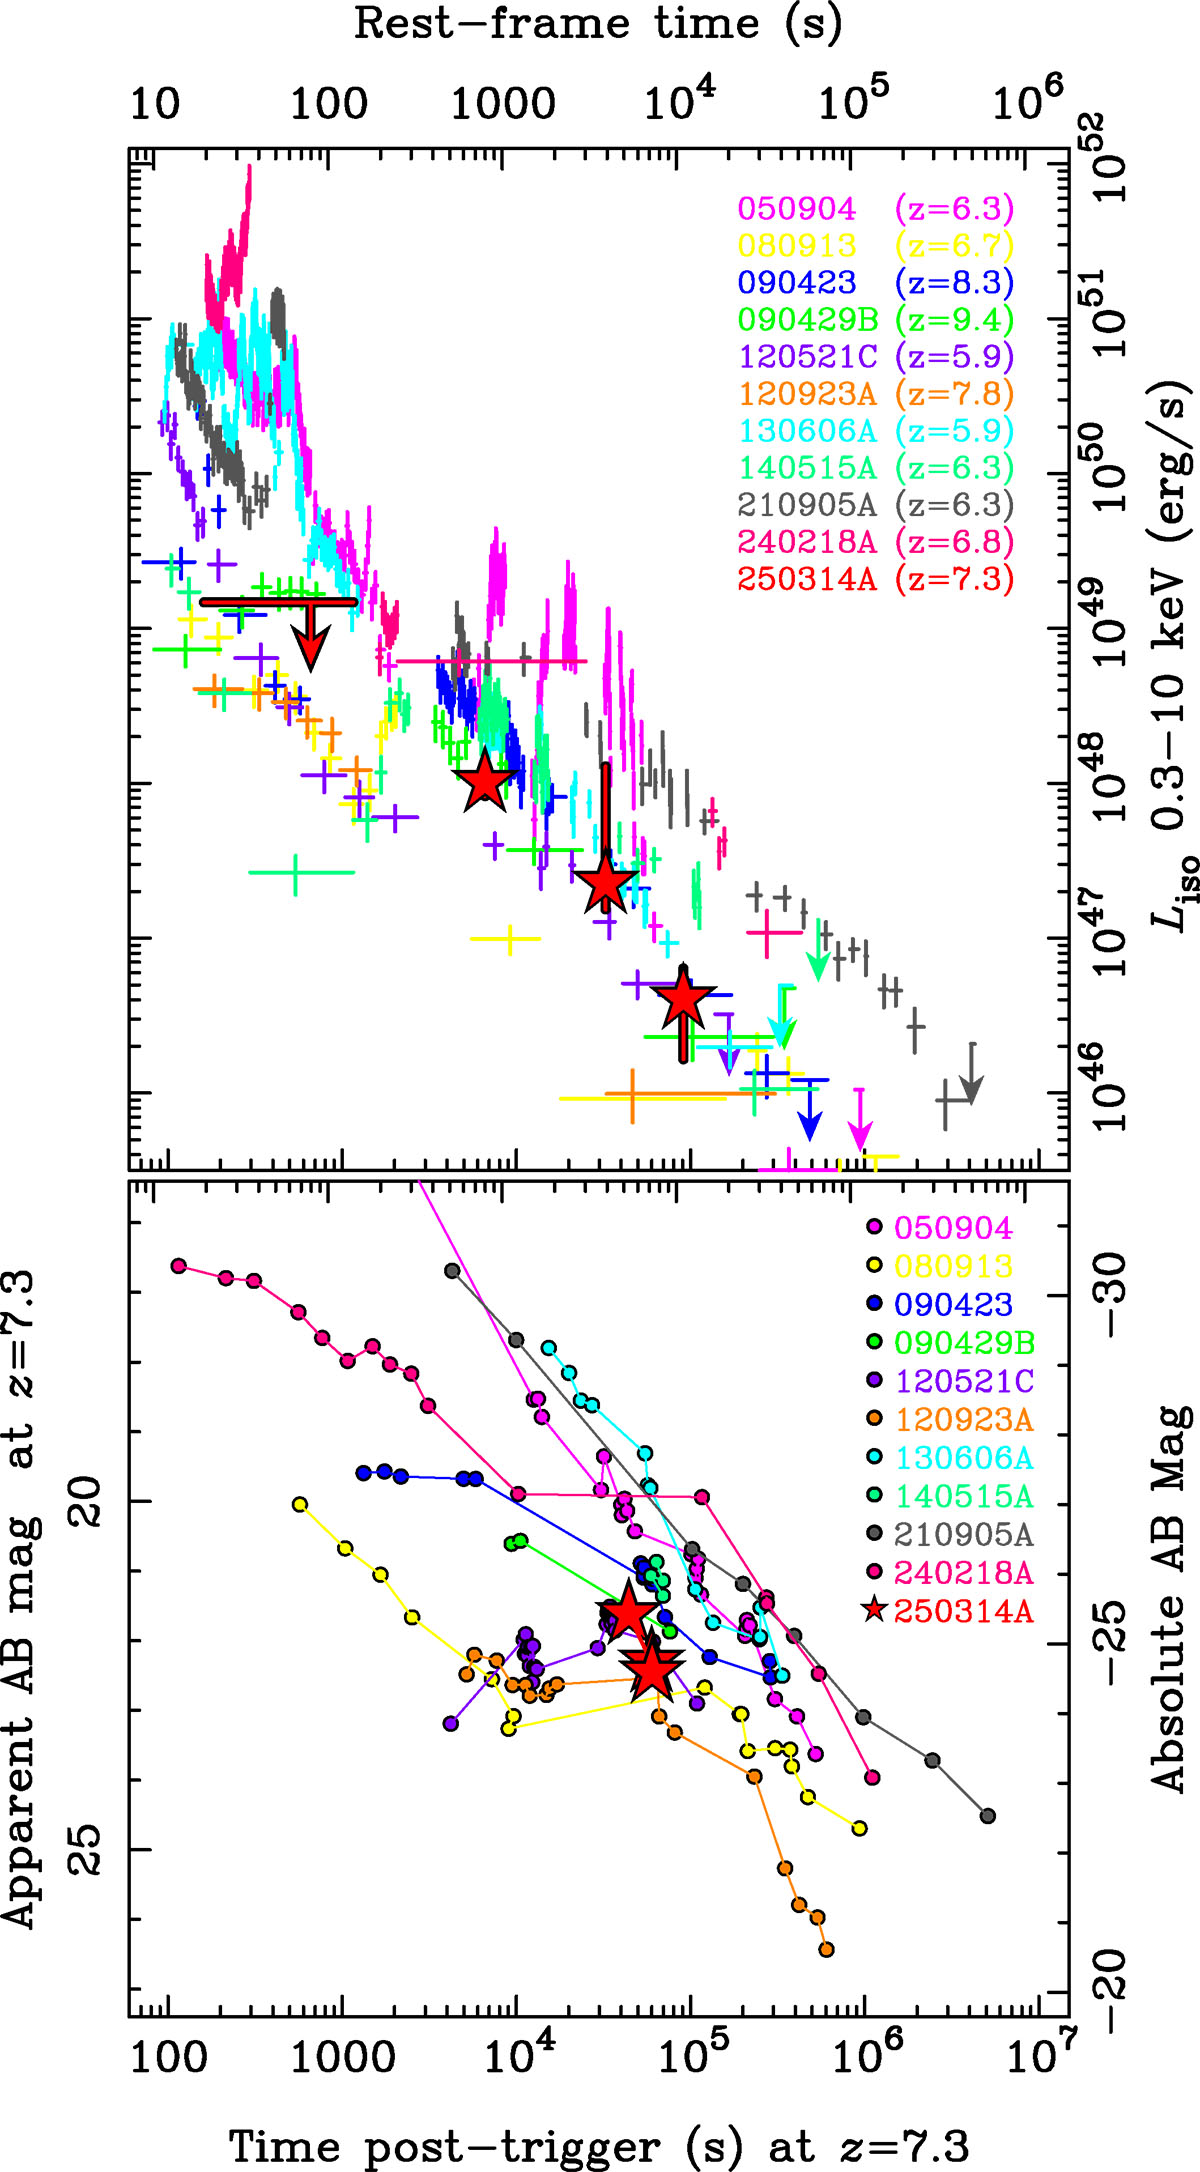
Fig. C.1.
Download original image
Comparison of the afterglow light curves of a sample of high-redshift GRBs (color-coded) to our data (cyan stars). Top: Unabsorbed X-ray luminosity (0.3-10 keV), deduced for GRB250314A from the SVOM/MXT, Swift/XRT, and Einstein Probe/FXT data in Table C.1, and obtained through the Swift burst analyser (Evans et al. 2010) for the other high-redshift GRBs. Bottom: Optical light curves. Each rest-frame light curve is shifted to a common z = 7.3 redshift and to the H band. Only detections redwards of the Ly-α break are included. Optical light curves of high-redshift afterglows are taken from Tanvir et al. (2018) and references therein, Rossi et al. (2022), Brivio et al. (2025).
Current usage metrics show cumulative count of Article Views (full-text article views including HTML views, PDF and ePub downloads, according to the available data) and Abstracts Views on Vision4Press platform.
Data correspond to usage on the plateform after 2015. The current usage metrics is available 48-96 hours after online publication and is updated daily on week days.
Initial download of the metrics may take a while.