Fig. D.1.
Download original image
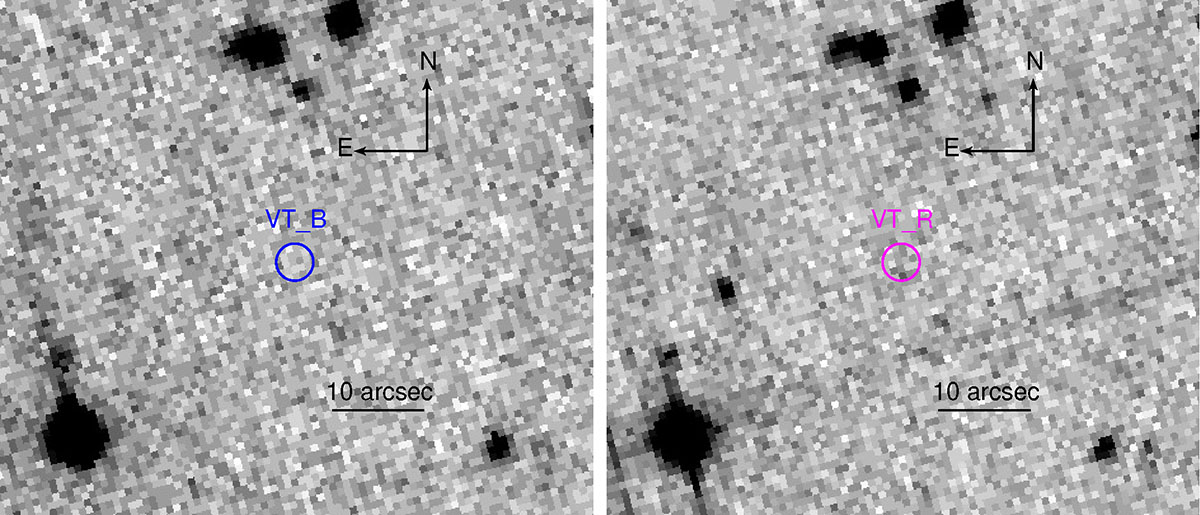
VT stacked image in VT_B and VT_R bands. The total effective exposure time is 24×50 s and 23×50 s for VT_B and VT_R bands, respectively, at a mid-time of 13.9 min after the burst. The upper represents the north, and the left represents the east. The central red circle denotes the location of GRB 250314A. No signal is detected.
Current usage metrics show cumulative count of Article Views (full-text article views including HTML views, PDF and ePub downloads, according to the available data) and Abstracts Views on Vision4Press platform.
Data correspond to usage on the plateform after 2015. The current usage metrics is available 48-96 hours after online publication and is updated daily on week days.
Initial download of the metrics may take a while.