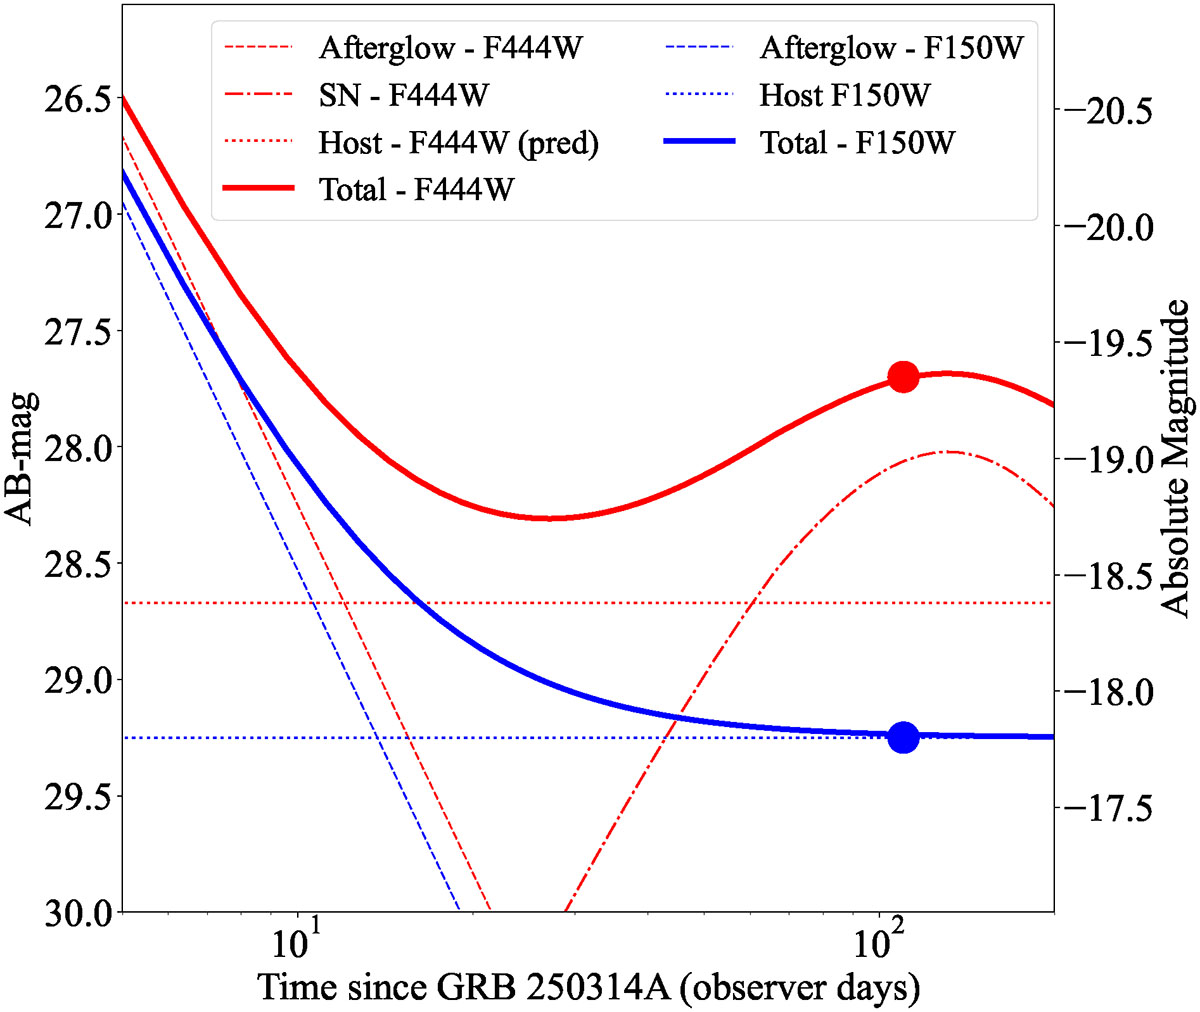
Fig. 1.
Download original image
Light curve of GRB 250314A as expected in the F150W2 and F444W bands. Components from both afterglow, SN, and host galaxy are included. Expectations for the afterglow are based on the ground-based J and H measurements, extrapolated to F444W based on the measured spectral slope. The host galaxy magnitudes are similarly based on the F150W2 detection (see text) and extrapolated to F444W based on the typical galaxy spectrum at z ∼ 7. The observed points are also indicated, demonstrating luminosity consistency between observations and a SN 1998bw-like SN (in this case scaled to 70% of the luminosity of SN 1998bw).
Current usage metrics show cumulative count of Article Views (full-text article views including HTML views, PDF and ePub downloads, according to the available data) and Abstracts Views on Vision4Press platform.
Data correspond to usage on the plateform after 2015. The current usage metrics is available 48-96 hours after online publication and is updated daily on week days.
Initial download of the metrics may take a while.