Fig. 3
Download original image
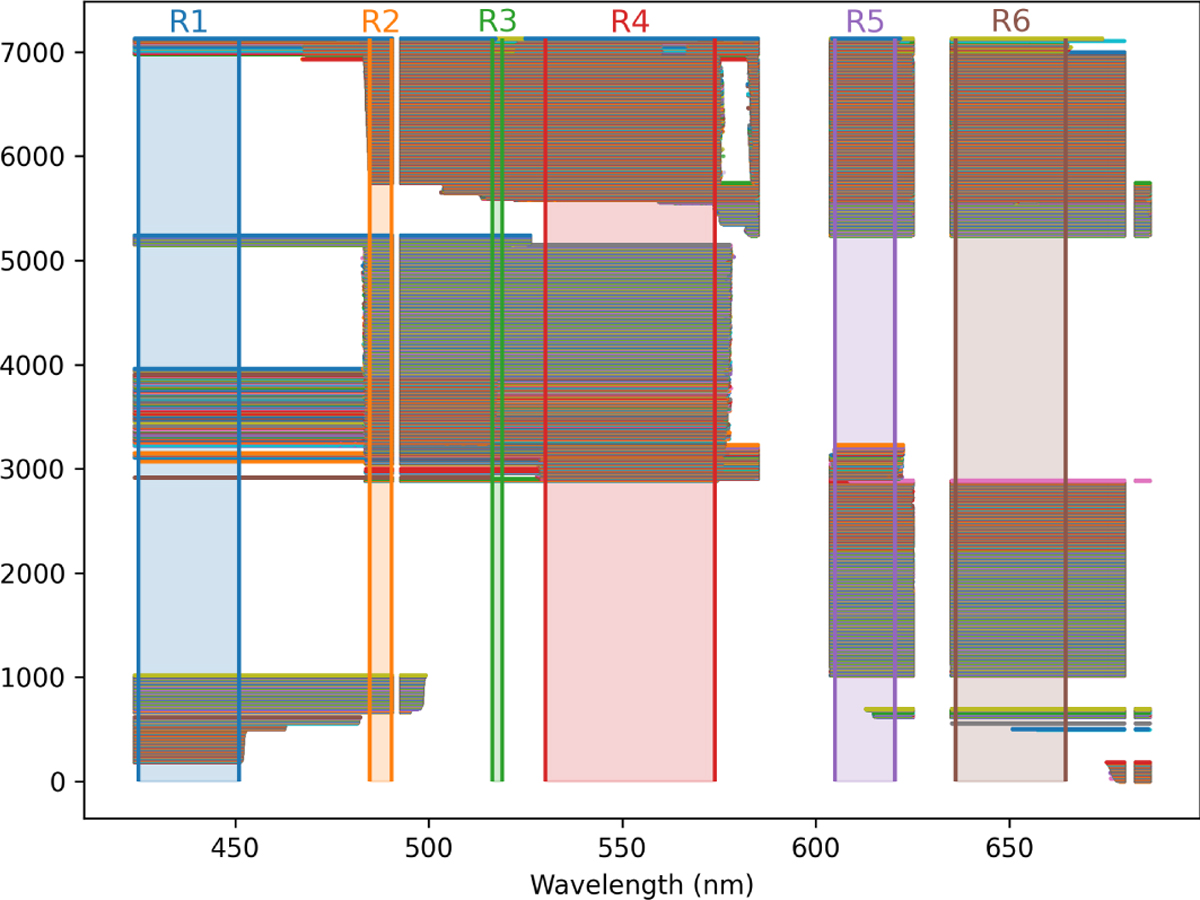
Wavelength range of each of the >7000 spectra in our sample, limited to the interval between 400–700 nm. Each spectra is represented as a horizontal line. The shaded regions (R1 to R6) indicate the selected regions to be analysed. Some of the empty spaces correspond to artifacts in the spectra or regions of telluric lines that were masked.
Current usage metrics show cumulative count of Article Views (full-text article views including HTML views, PDF and ePub downloads, according to the available data) and Abstracts Views on Vision4Press platform.
Data correspond to usage on the plateform after 2015. The current usage metrics is available 48-96 hours after online publication and is updated daily on week days.
Initial download of the metrics may take a while.