Fig. 4
Download original image
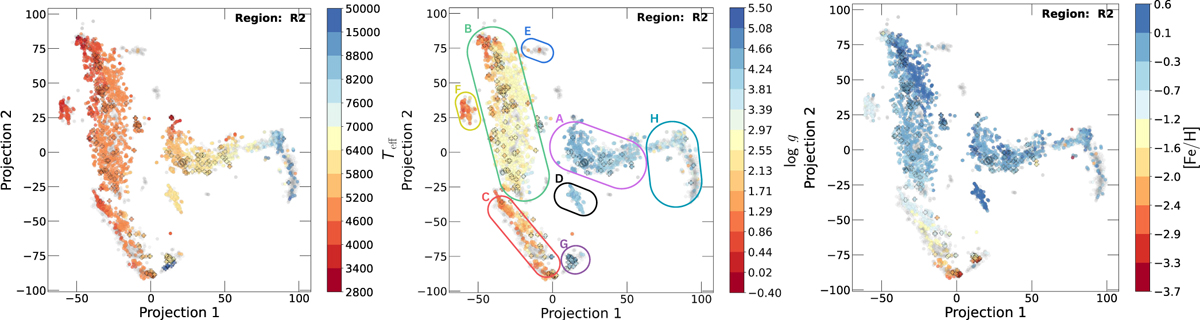
t-SNE projection map of the region R2 colour-coded by the atmospheric parameters from the GES catalogue, Teff (left), log g (centre), and [Fe/H] (right). The axes do not have direct physical meaning as they are not linear combinations of the original data; they are simply indicative of relative neighbourhood of the data points in these projections.
Current usage metrics show cumulative count of Article Views (full-text article views including HTML views, PDF and ePub downloads, according to the available data) and Abstracts Views on Vision4Press platform.
Data correspond to usage on the plateform after 2015. The current usage metrics is available 48-96 hours after online publication and is updated daily on week days.
Initial download of the metrics may take a while.