Fig. 5
Download original image
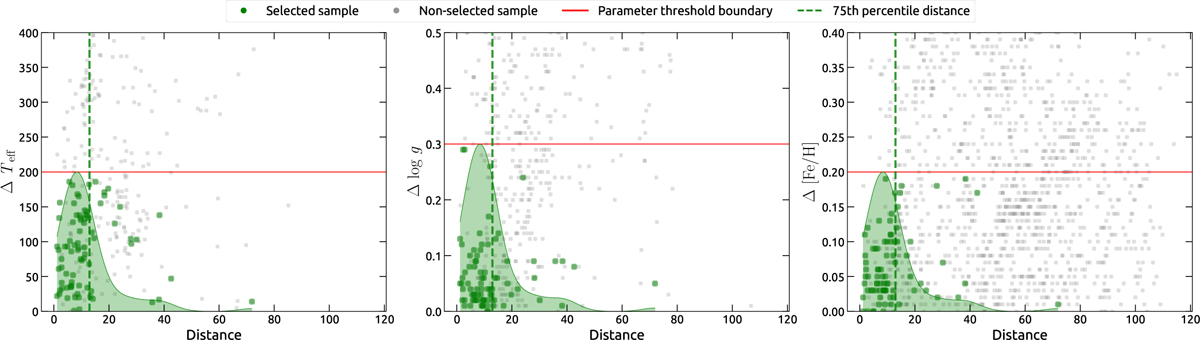
Distribution of distances in the t-SNE projection for stars with similar atmospheric parameters to the Sun, using the GES catalogue for the sample and spectral region R2. The absolute values of the differences in Teff, log g, and [Fe/H] are shown in the left, centre, and right panels, respectively. In each panel, the red horizontal line indicates the adopted parameter thresholds; green points represent the similar spectra which fulfil all three of the parameter thresholds, and the green vertical dashed line marks the 75th percentile of their distances from the reference.
Current usage metrics show cumulative count of Article Views (full-text article views including HTML views, PDF and ePub downloads, according to the available data) and Abstracts Views on Vision4Press platform.
Data correspond to usage on the plateform after 2015. The current usage metrics is available 48-96 hours after online publication and is updated daily on week days.
Initial download of the metrics may take a while.