Fig. 6
Download original image
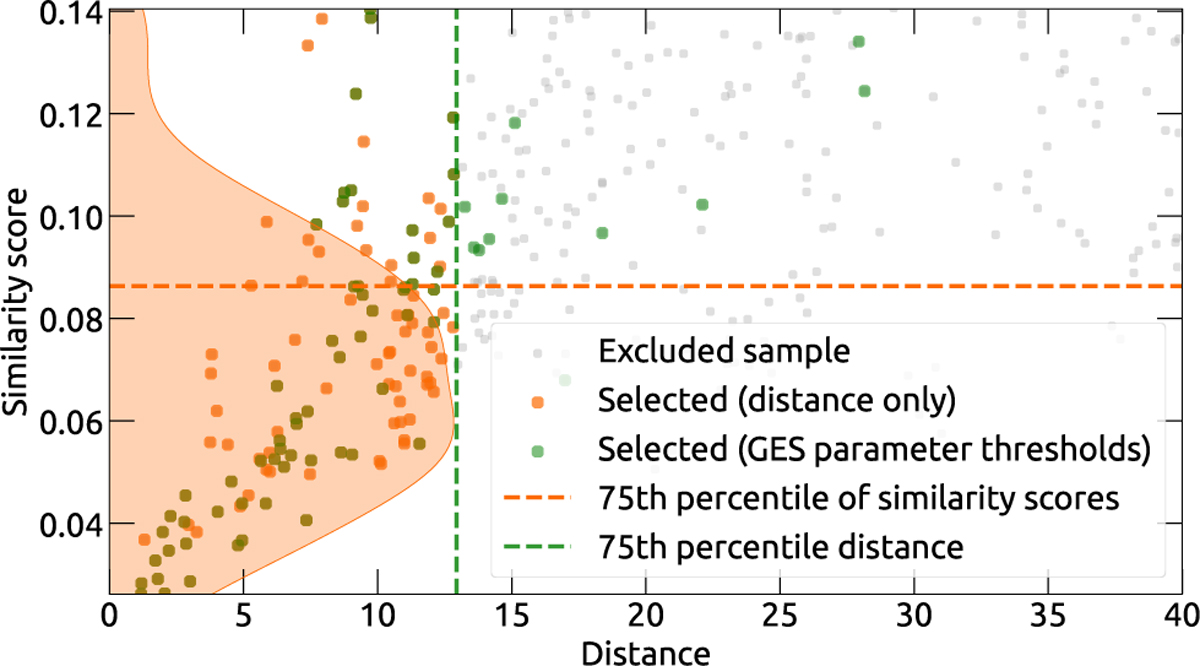
Distribution of similarity score values of the sample surrounding the Sun. The lower the similarity score, the more similar is the stellar spectrum to the solar spectrum. The green points have the same meaning as in Fig. 5. Orange points are all the stars within the 75th percentile of distances defined in Fig. 5. The orange horizontal dashed line indicates the 75th percentile of the distribution of similarity scores. Note that the total range of similarity scores is much larger; the figure shows only nearby stars.
Current usage metrics show cumulative count of Article Views (full-text article views including HTML views, PDF and ePub downloads, according to the available data) and Abstracts Views on Vision4Press platform.
Data correspond to usage on the plateform after 2015. The current usage metrics is available 48-96 hours after online publication and is updated daily on week days.
Initial download of the metrics may take a while.