Fig. 9
Download original image
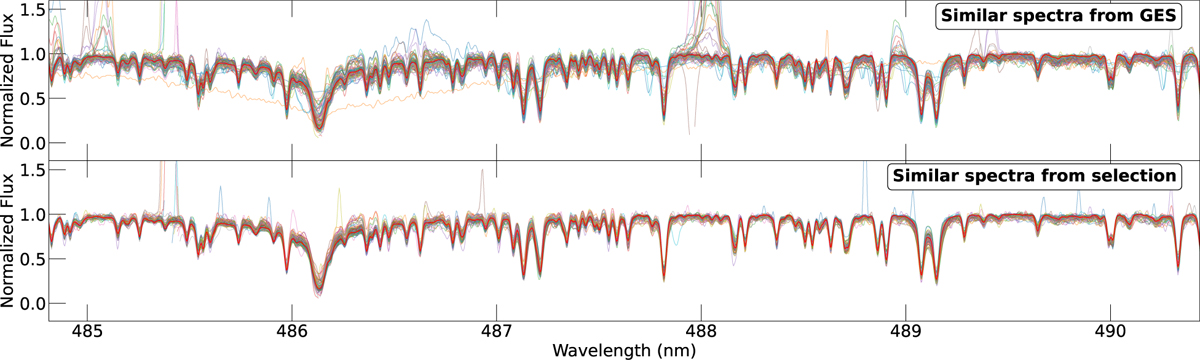
Comparison of similar spectra to a reference spectrum of the Sun (red line), obtained in two different ways: using the GES catalogue as reference (top panel) and the selected sample using our methodology (bottom panel). Both panels display the corresponding normalized spectra for the region R2 with different colours to show the different spectra.
Current usage metrics show cumulative count of Article Views (full-text article views including HTML views, PDF and ePub downloads, according to the available data) and Abstracts Views on Vision4Press platform.
Data correspond to usage on the plateform after 2015. The current usage metrics is available 48-96 hours after online publication and is updated daily on week days.
Initial download of the metrics may take a while.