Fig. 1
Download original image
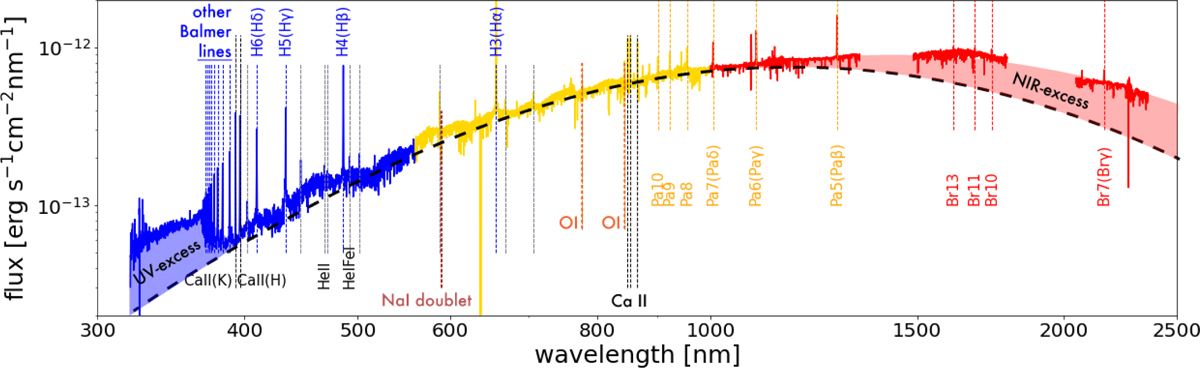
X-shooter spectrum of the CTTS VW Cha. The UVB, VIS and NIR spectra are plotted in blue, yellow, and red, respectively. The UV-excess (blue region), tracing the accretion activity, and the NIR-excess (red region), tracing the presence of an active disk, are highlighted. The black curved dashed line corresponds to a stylized stellar photosphere + continuum veiling. All the accretion tracers for which Alcalá et al. (2017) provided empirical relations are shown in different colors, but not all the lines are labelled in the figure because of limited space. Also Br13, Br11, and Br10 lines are shown. Note: the spectrum starting wavelength was artificially set at ~320 nm for plotting purposes, while the actual UV-cut of X-shooter is at ~300 nm.
Current usage metrics show cumulative count of Article Views (full-text article views including HTML views, PDF and ePub downloads, according to the available data) and Abstracts Views on Vision4Press platform.
Data correspond to usage on the plateform after 2015. The current usage metrics is available 48-96 hours after online publication and is updated daily on week days.
Initial download of the metrics may take a while.