Open Access
Fig. D.2
Download original image
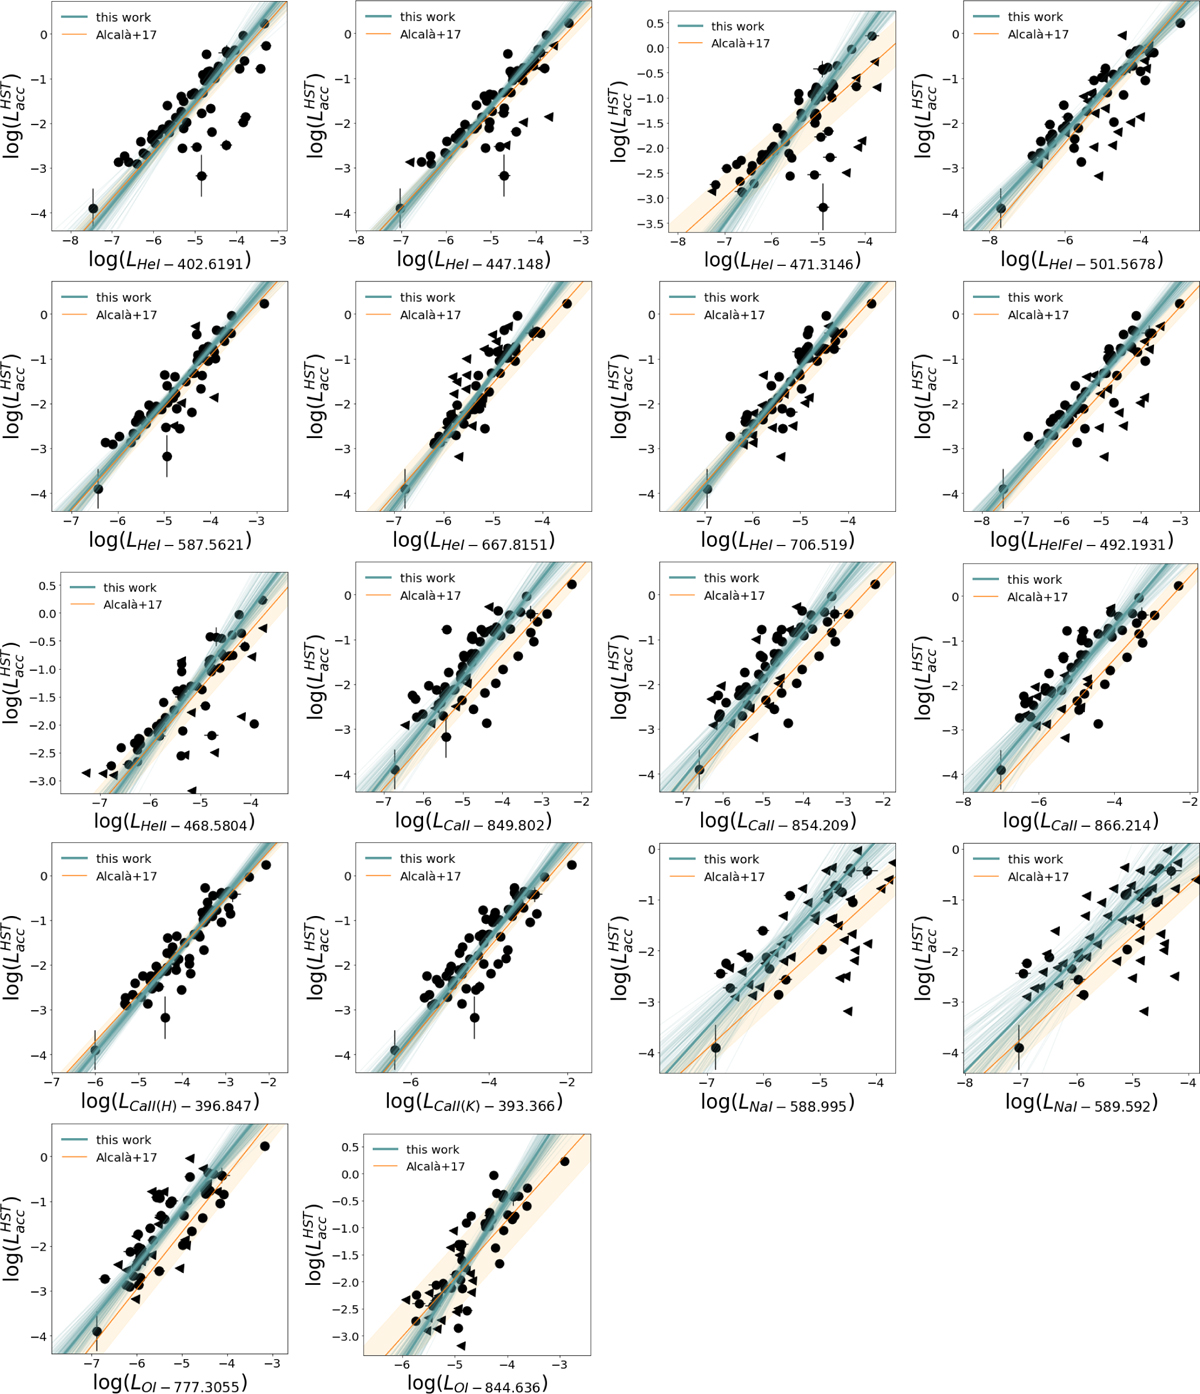
log Lacc − log Lline and best fit for the helium, calcium, sodium, and oxygen accretion tracers. The blue and orange lines show our best fit and the best fit from Alcalá et al. (2017), respectively. The wavelength in nanometers of each line is shown on the x-axis. Triangles are upper limits.
Current usage metrics show cumulative count of Article Views (full-text article views including HTML views, PDF and ePub downloads, according to the available data) and Abstracts Views on Vision4Press platform.
Data correspond to usage on the plateform after 2015. The current usage metrics is available 48-96 hours after online publication and is updated daily on week days.
Initial download of the metrics may take a while.