Fig. E.1
Download original image
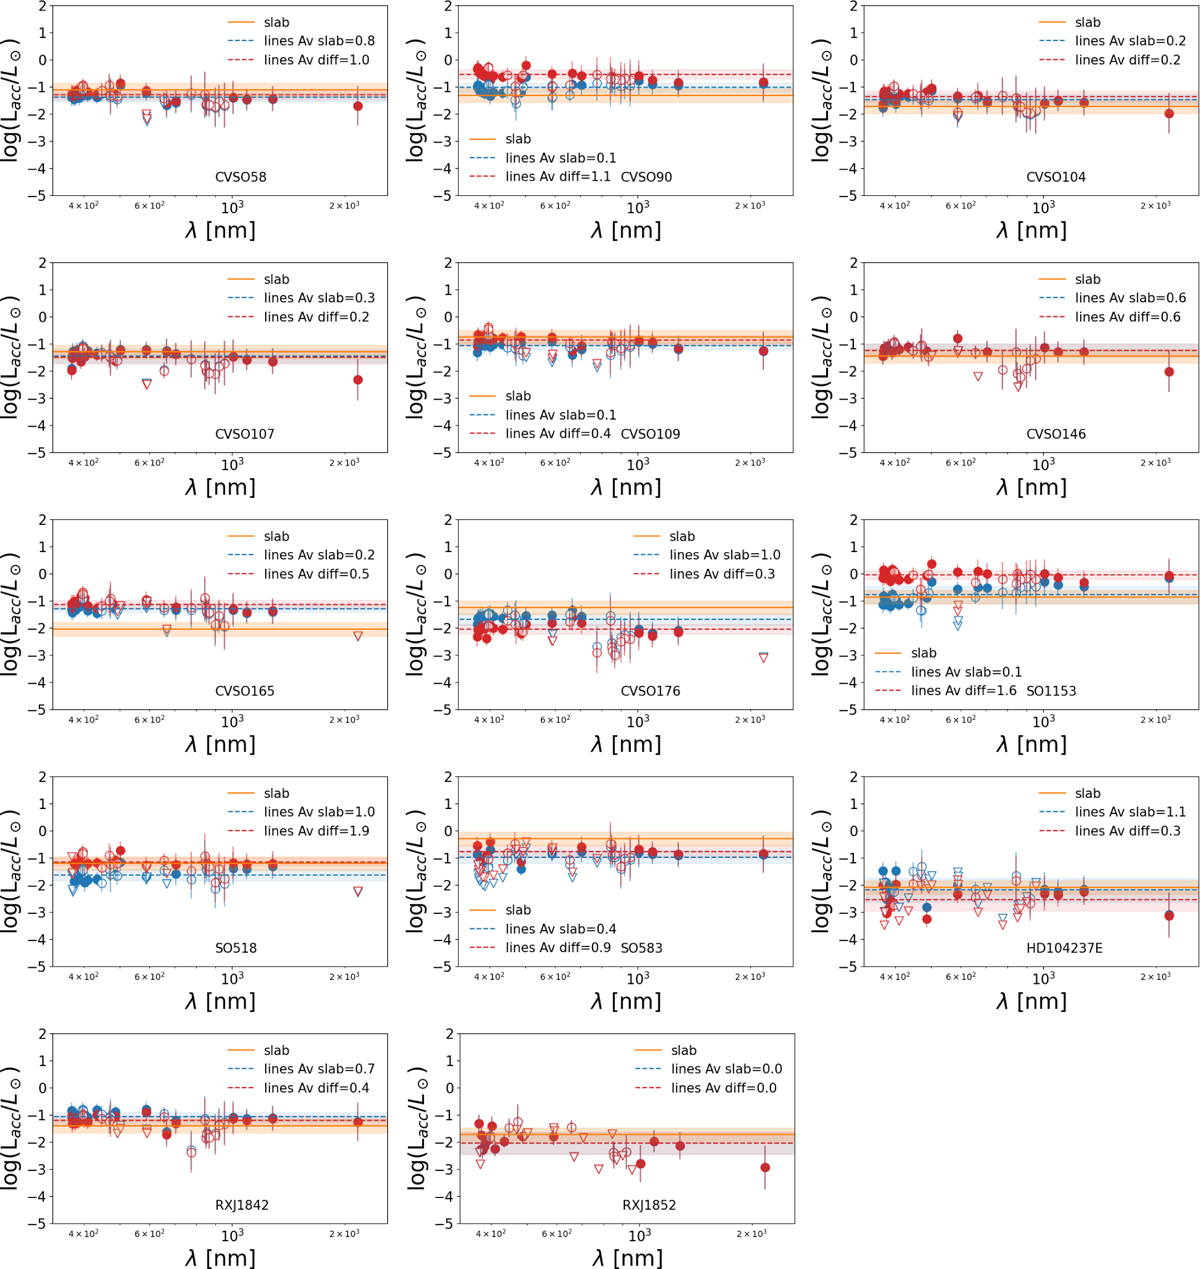
log Lacc as a function of the wavelength for CTTS in the OB1, σOri, ϵCha and Corona Australis star forming regions. The orange line represents the log ![]() computed using the XS-fit method and its associated extinction value (
computed using the XS-fit method and its associated extinction value (![]() ). The blue dots show log
). The blue dots show log ![]() (Table A.1) calculated from the accretion tracers using the empirical relations from Alcalá et al. (2014), with fluxes dereddened using
(Table A.1) calculated from the accretion tracers using the empirical relations from Alcalá et al. (2014), with fluxes dereddened using ![]() . Similarly, the red dots represent
. Similarly, the red dots represent ![]() , computed from the same accretion tracers but with fluxes dereddened using
, computed from the same accretion tracers but with fluxes dereddened using ![]() (see Sect. 3.6 and Table 1). The blue and red dashed lines indicate the mean log Lacc values for the accretion tracers log Lacc,i in their respective colors.
(see Sect. 3.6 and Table 1). The blue and red dashed lines indicate the mean log Lacc values for the accretion tracers log Lacc,i in their respective colors.
Current usage metrics show cumulative count of Article Views (full-text article views including HTML views, PDF and ePub downloads, according to the available data) and Abstracts Views on Vision4Press platform.
Data correspond to usage on the plateform after 2015. The current usage metrics is available 48-96 hours after online publication and is updated daily on week days.
Initial download of the metrics may take a while.