Fig. 3
Download original image
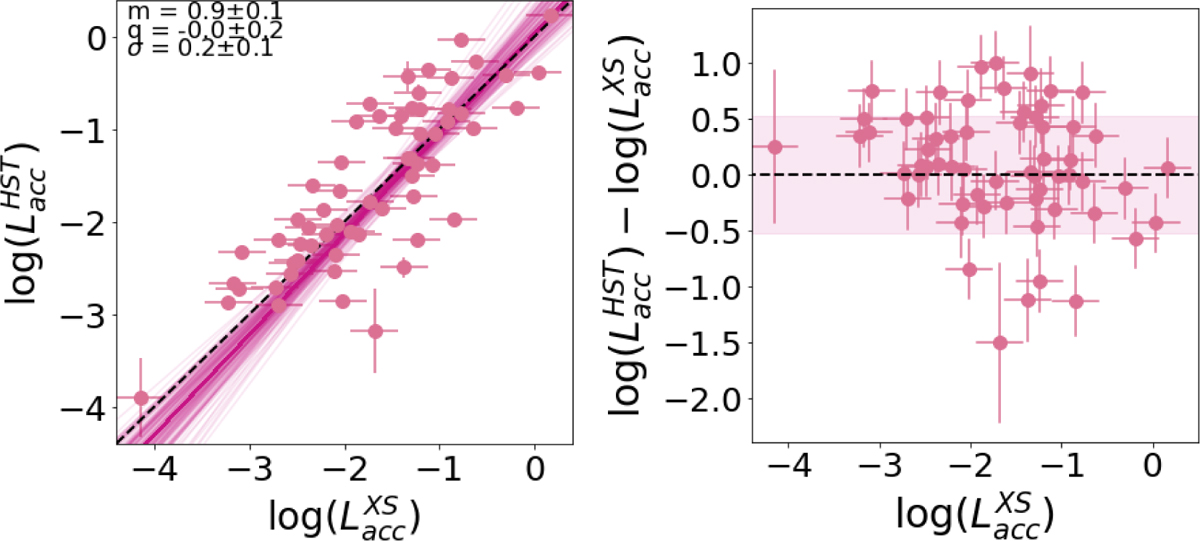
Comparison of Lacc computed using the HST modeling with that from the XS-fit. Left: log ![]() vs. log
vs. log ![]() , the pink line show the best fit, which is linear within the error with its dispersion. Right: differential analysis, the pink region corresponds to the standard deviation of log
, the pink line show the best fit, which is linear within the error with its dispersion. Right: differential analysis, the pink region corresponds to the standard deviation of log ![]() − log
− log ![]() , computed as the quadrature sum of the individual errors.
, computed as the quadrature sum of the individual errors.
Current usage metrics show cumulative count of Article Views (full-text article views including HTML views, PDF and ePub downloads, according to the available data) and Abstracts Views on Vision4Press platform.
Data correspond to usage on the plateform after 2015. The current usage metrics is available 48-96 hours after online publication and is updated daily on week days.
Initial download of the metrics may take a while.