Fig. 5
Download original image
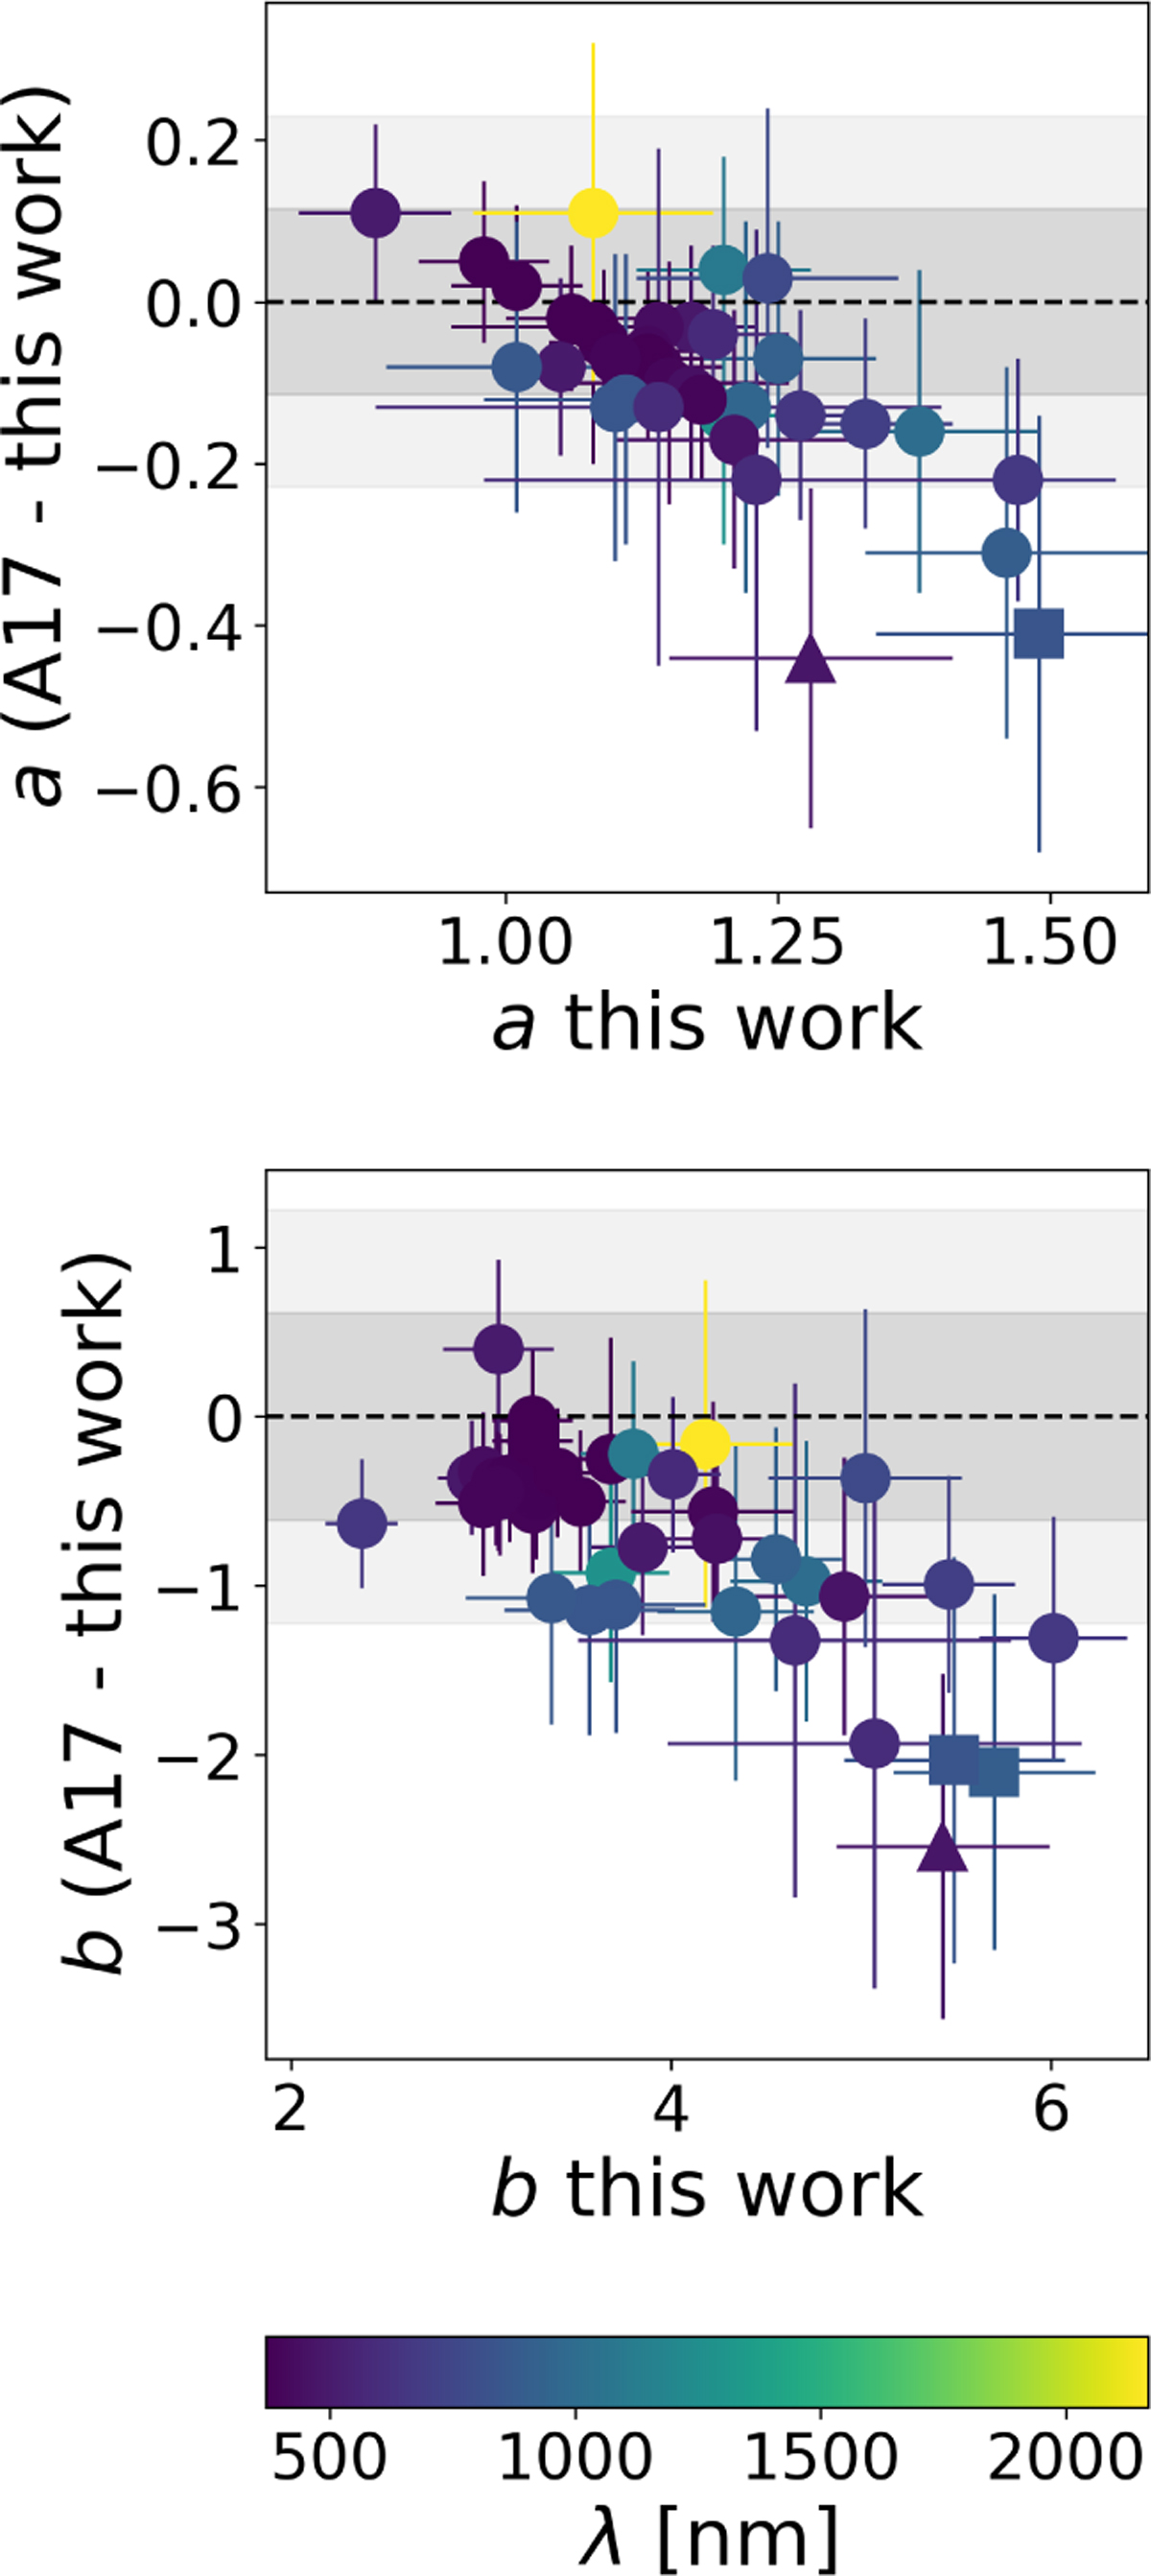
Comparison of the slopes (top) and intercepts (bottom) of the log Lacc − log Llines empirical relations derived in this work with those from Alcalá et al. (2017). The colorbar indicates the corresponding wavelength of each accretion tracer, ranging from UVB (blue) to NIR (yellow). Dark and light gray regions represent agreement within 1σ and 2σ, respectively. Accretion tracers not in agreement within 1σ (2σ) within the error are plotted as squares (triangles).
Current usage metrics show cumulative count of Article Views (full-text article views including HTML views, PDF and ePub downloads, according to the available data) and Abstracts Views on Vision4Press platform.
Data correspond to usage on the plateform after 2015. The current usage metrics is available 48-96 hours after online publication and is updated daily on week days.
Initial download of the metrics may take a while.