Fig. 6
Download original image
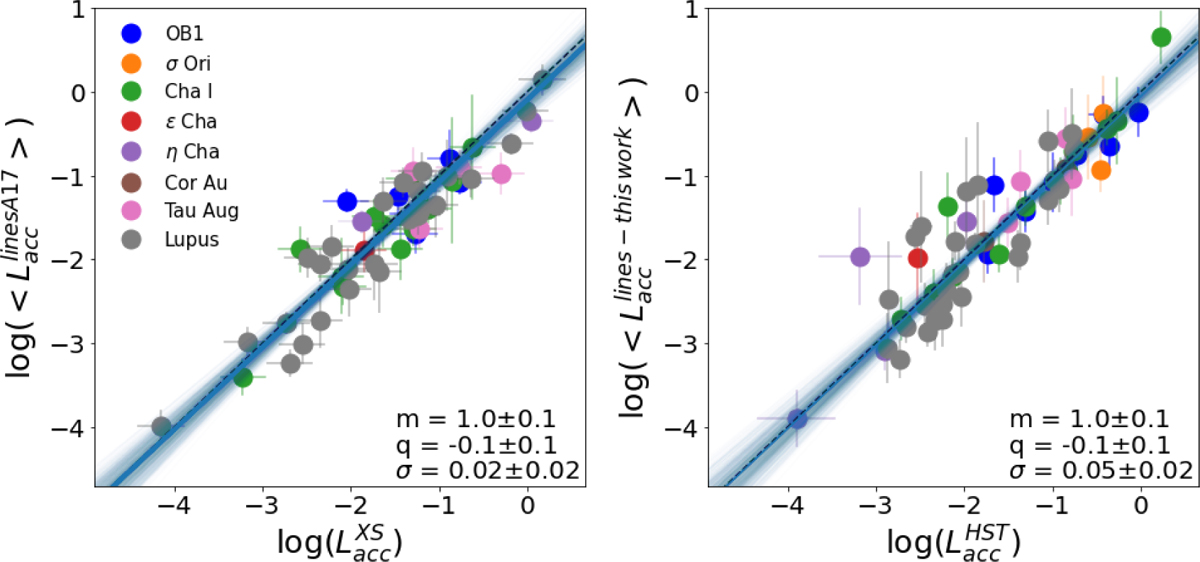
![]() vs. log
vs. log ![]() . Colors of the points represent different star-forming regions as described in the legend. The blue line corresponds to our best fit. The dashed black line shows the linear trend as a reference. Left: log < Lacc >lines is computed as the average from the Lacc’s from many lines and using empirical relations by Alcalá et al. (2017) and log
. Colors of the points represent different star-forming regions as described in the legend. The blue line corresponds to our best fit. The dashed black line shows the linear trend as a reference. Left: log < Lacc >lines is computed as the average from the Lacc’s from many lines and using empirical relations by Alcalá et al. (2017) and log ![]() is obtained using the XS-fit method. Right: log < Lacc >lines is computed as the average from the Lacc’s from many lines and using empirical relations obtained in this work and log
is obtained using the XS-fit method. Right: log < Lacc >lines is computed as the average from the Lacc’s from many lines and using empirical relations obtained in this work and log ![]() is obtained using the HST-fit method.
is obtained using the HST-fit method.
Current usage metrics show cumulative count of Article Views (full-text article views including HTML views, PDF and ePub downloads, according to the available data) and Abstracts Views on Vision4Press platform.
Data correspond to usage on the plateform after 2015. The current usage metrics is available 48-96 hours after online publication and is updated daily on week days.
Initial download of the metrics may take a while.