Fig. 7
Download original image
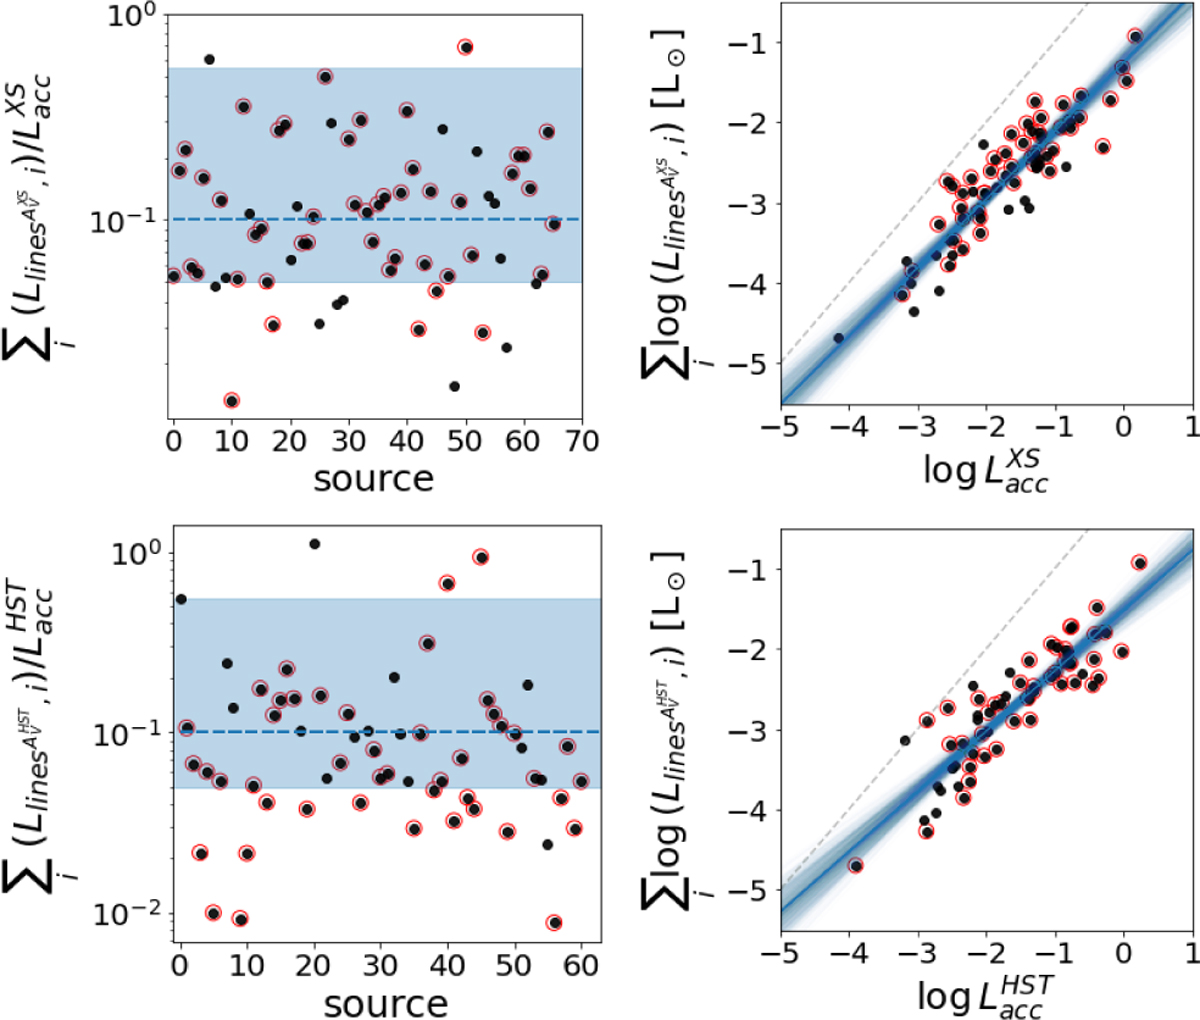
Left panels: fraction of the total luminosity in lines relative to the accretion luminosity, i.e. the continuum excess luminosity. The light blue region corresponds to the range of values found in Alcalá et al. (2014). Right panels: total luminosity from the lines as a function of the log Lacc as indicated in the labels. The blue line in each panel corresponds to our best fit, while the light-blue lines give an indication of the spread of the fit (see Sect. 3.4). The dashed gray lines show the one-to-one relation. Red circled black dots correspond to sources where the Brγ line is detected.
Current usage metrics show cumulative count of Article Views (full-text article views including HTML views, PDF and ePub downloads, according to the available data) and Abstracts Views on Vision4Press platform.
Data correspond to usage on the plateform after 2015. The current usage metrics is available 48-96 hours after online publication and is updated daily on week days.
Initial download of the metrics may take a while.