Fig. 9
Download original image
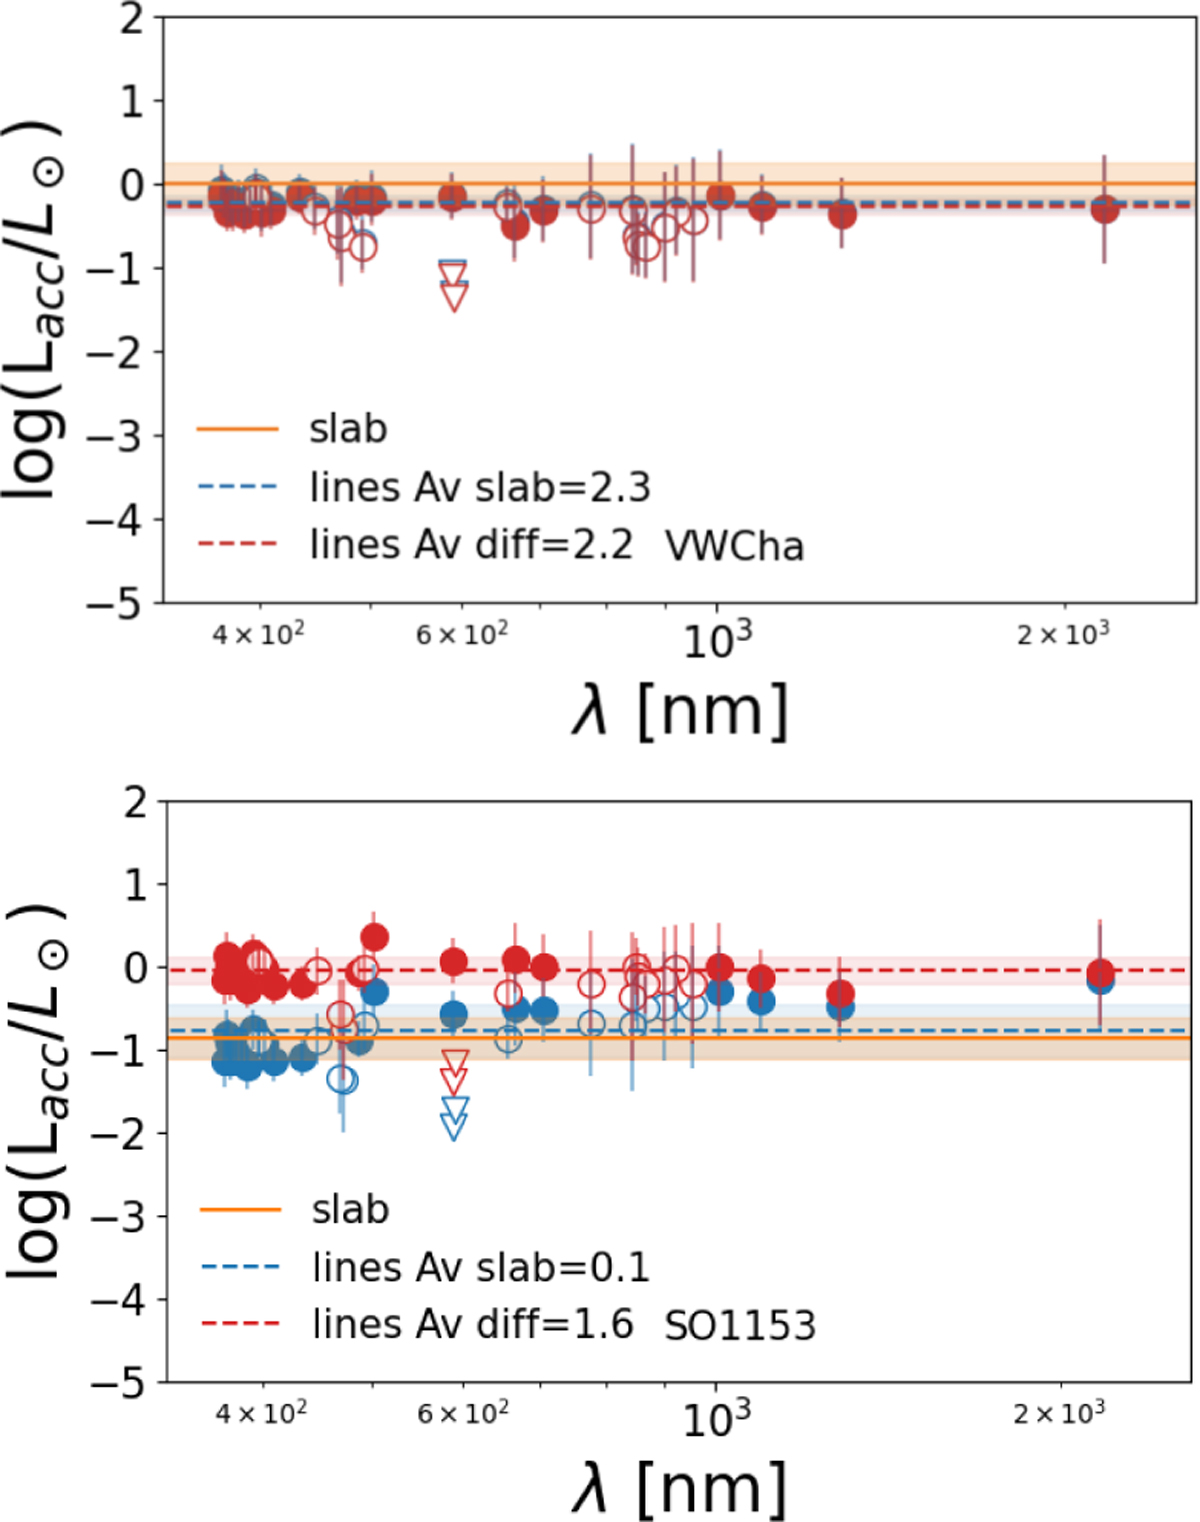
log Lacc as a function of the wavelength for two PENELLOPE CTTSs. Filled (empty) circles are log Lacc values computed using empirical relations, corresponding to suggested (non suggested) lines by Alcalá et al. (2014), while triangles represent upper limits. In red and blue results obtained by dereddening the flux with ![]() and
and ![]() are shown, respectively. Horizontal red and blue dashed lines and regions correspond to mean value and standard deviation of Lacc using
are shown, respectively. Horizontal red and blue dashed lines and regions correspond to mean value and standard deviation of Lacc using ![]() and
and ![]() , respectively. The orange solid line shows
, respectively. The orange solid line shows ![]() with its error bar (orange horizontal region). Top: plot for the multiple system VW Cha, where the extinction and accretion luminosity estimated with the difference method and the XS-fit are in agreement and the log Lacc distributions are flat. Bottom: SO1152 young star, where
with its error bar (orange horizontal region). Top: plot for the multiple system VW Cha, where the extinction and accretion luminosity estimated with the difference method and the XS-fit are in agreement and the log Lacc distributions are flat. Bottom: SO1152 young star, where ![]() and
and ![]() differ by 1.5 mag and the distribution of log Lacc obtained by dereddening the fluxes with
differ by 1.5 mag and the distribution of log Lacc obtained by dereddening the fluxes with ![]() is flatter than the one obtained using
is flatter than the one obtained using ![]() . The latter increases with the wavelength.
. The latter increases with the wavelength.
Current usage metrics show cumulative count of Article Views (full-text article views including HTML views, PDF and ePub downloads, according to the available data) and Abstracts Views on Vision4Press platform.
Data correspond to usage on the plateform after 2015. The current usage metrics is available 48-96 hours after online publication and is updated daily on week days.
Initial download of the metrics may take a while.