Fig. 1
Download original image
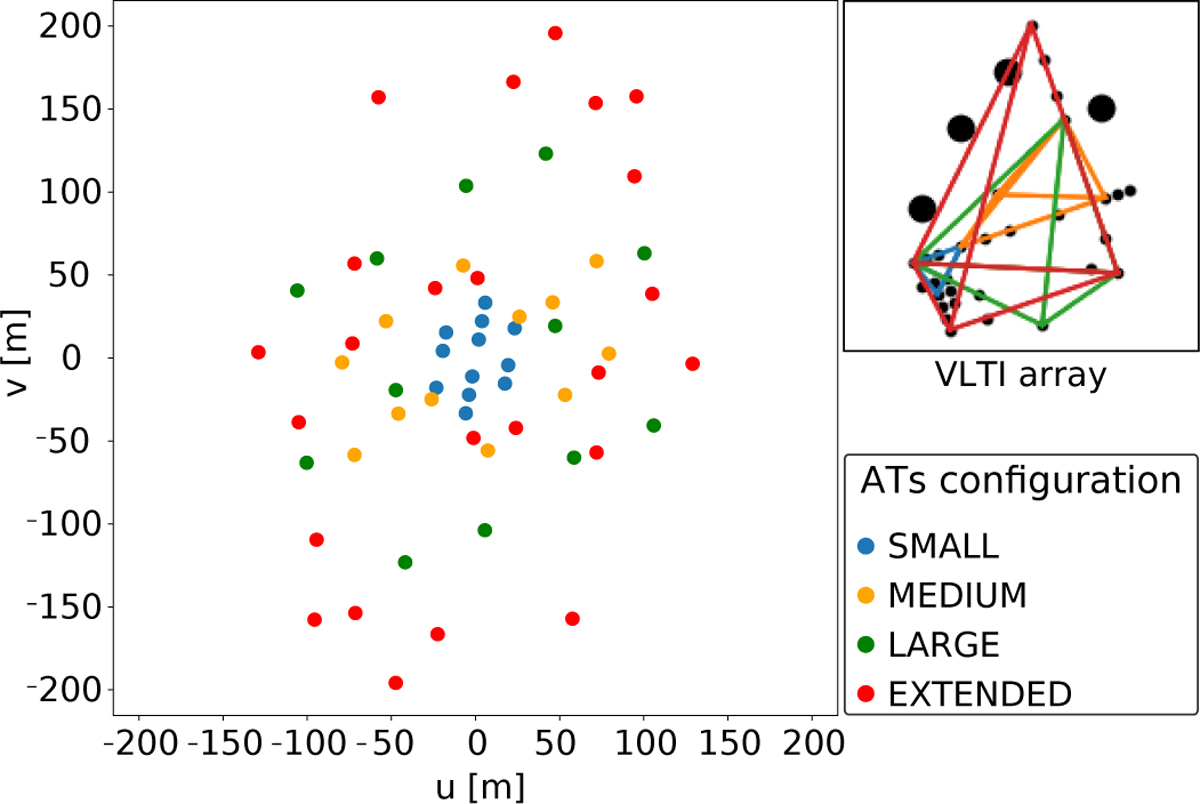
Coverage of the (u, v)-plane obtained from the VLTI/MATISSE observations of 3 Puppis. The legend in the lower-right corner indicates the colours corresponding to the four AT configurations used: small (blue), medium (orange), large (green), and extended (red). A schematic map of the VLTI baselines, using the same colour code, is shown in the upper-right corner. East corresponds to increasing x-axis values, and north to increasing y-axis values.
Current usage metrics show cumulative count of Article Views (full-text article views including HTML views, PDF and ePub downloads, according to the available data) and Abstracts Views on Vision4Press platform.
Data correspond to usage on the plateform after 2015. The current usage metrics is available 48-96 hours after online publication and is updated daily on week days.
Initial download of the metrics may take a while.