Fig. C.2
Download original image
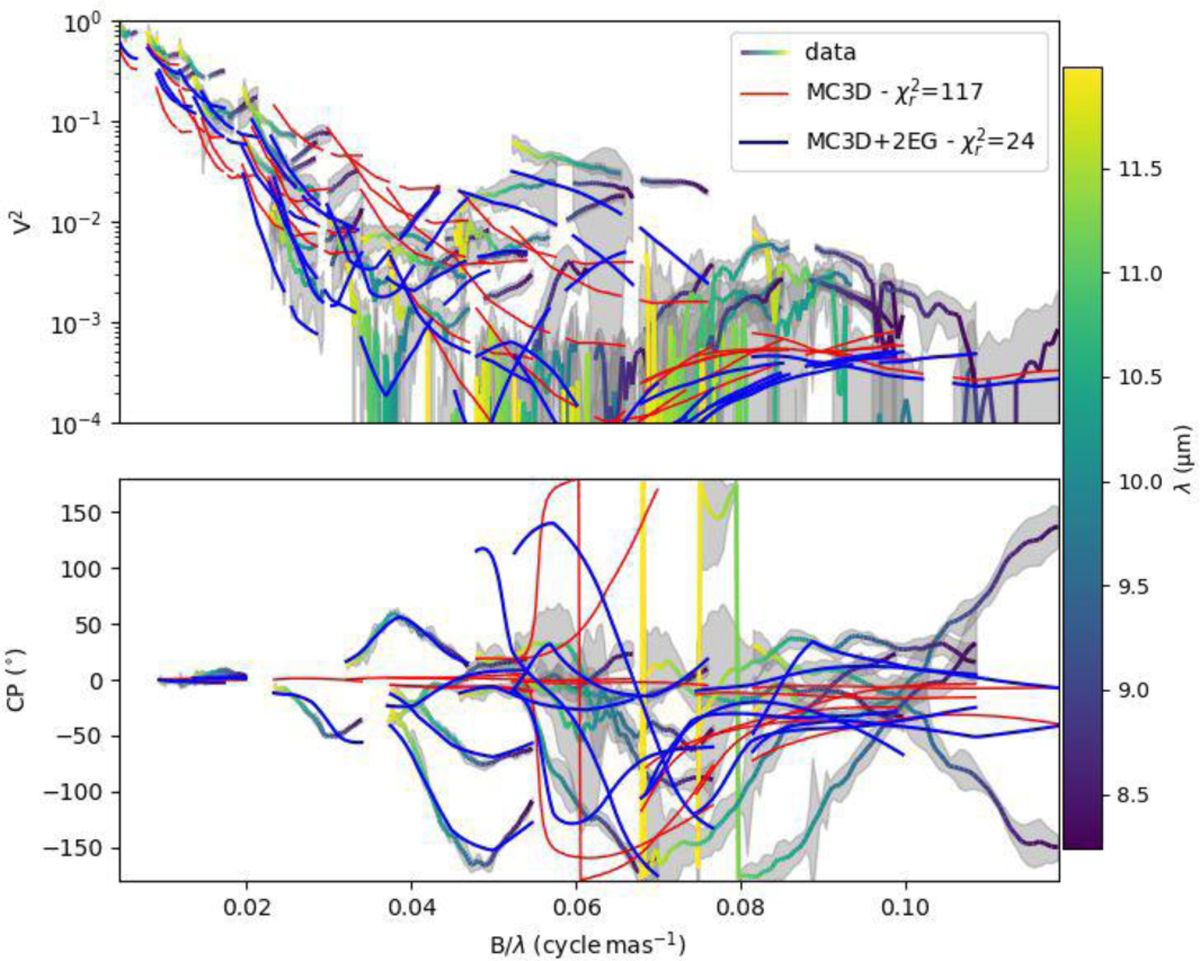
Comparison in the N-band between the VLTI/MATISSE data of 3 Puppis (in colour gradient from green to yellow), the best-fit MC3D model from Meilland et al. (2010) (in red) composed of a single centred Gaussian component plus an extended background, and the same MC3D model combined with two elliptical Gaussian components (i.e. {MC3D + 2EG} model; in blue) to account for the bright SE asymmetry and the fainter NW model provides a significantly better fit to the MATISSE interferometric observables than the original MC3D model constrained by MIDI data, with a reduced chi-squared of 24 versus 117. Top plot: Squared visibilities (V2) in logarithmic scale as a function of spatial frequency. Bottom plot: Closure phases (CPs) as a function of spatial frequency.
Current usage metrics show cumulative count of Article Views (full-text article views including HTML views, PDF and ePub downloads, according to the available data) and Abstracts Views on Vision4Press platform.
Data correspond to usage on the plateform after 2015. The current usage metrics is available 48-96 hours after online publication and is updated daily on week days.
Initial download of the metrics may take a while.