Fig. D.1
Download original image
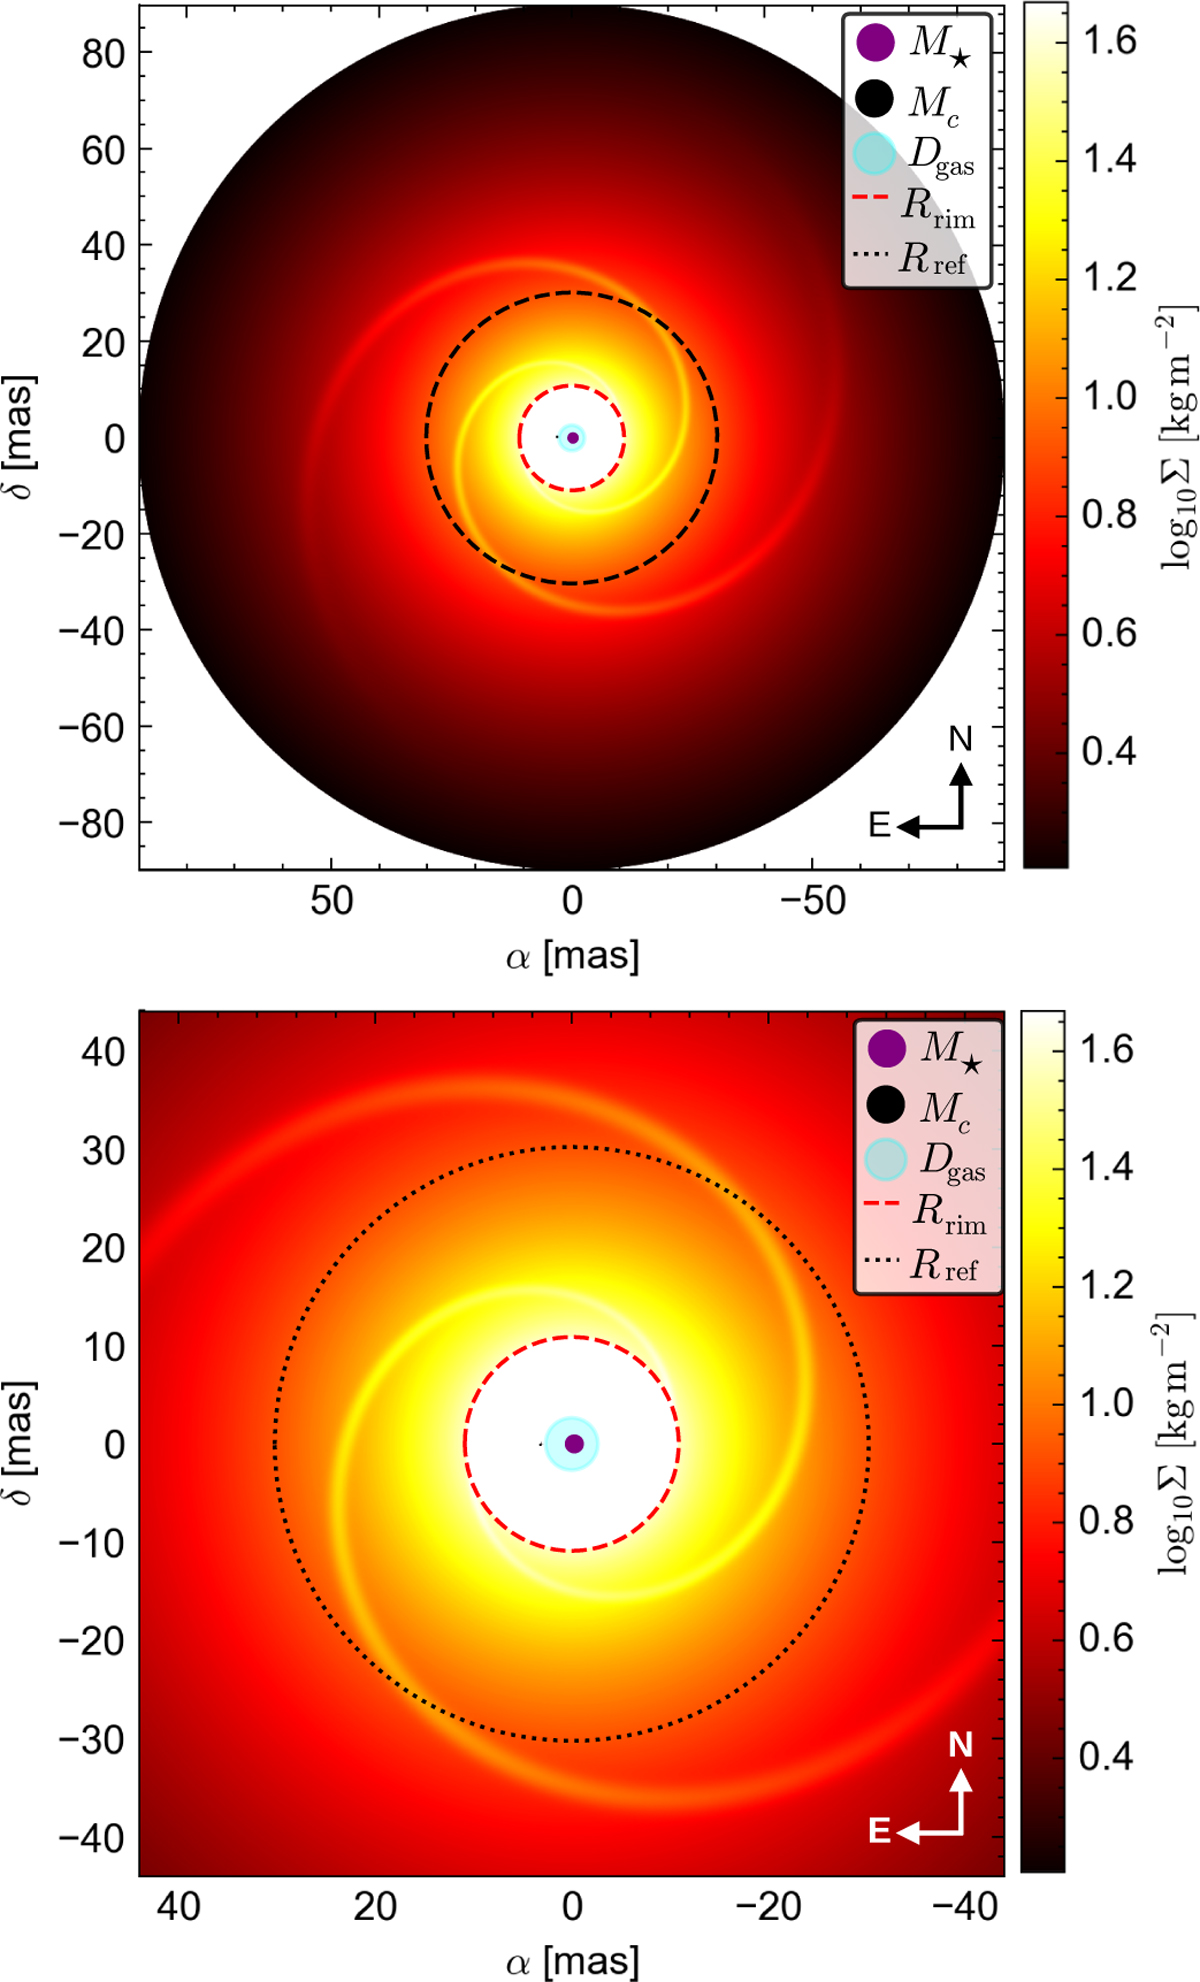
Synthetic surface density map Σ derived from an analytic spiral density model simulating tidally induced perturbations in the cir-cumbinary disc of 3 Puppis. The model incorporates two trailing spiral arm perturbations caused by the binary companion. The red dashed circle marks the inner dust rim Rrim ≃ 5.7 mas (∼3.6 au at 631 pc), and the black dotted circle indicates the radius of the SE asymmetric structure Rref ≃ 16.71 mas (∼10 au at 631 pc) inferred from the L-band MYTHRA image. Binary star positions are marked with dot symbols (purple for the supergiant star and black for the low-mass companion) scaled to the correct mass ratio and projected separation (stellar radii not to scale). The gas disc extension Dgas ∼ 4.39 mas (∼0.88 au at 631 pc) is displayed as a blue circle to scale. Both panels use logarithmic colour scaling to represent the local gas surface density normalised to 20% contrast. Left plot: Wide FoV (160 mas × 160 mas) in sky-plane Cartesian coordinates (α, δ). Right plot: Same simulation with a FoV matching the VLTI/MATISSE M-band MYTHRA image (87 mas × 87 mas).
Current usage metrics show cumulative count of Article Views (full-text article views including HTML views, PDF and ePub downloads, according to the available data) and Abstracts Views on Vision4Press platform.
Data correspond to usage on the plateform after 2015. The current usage metrics is available 48-96 hours after online publication and is updated daily on week days.
Initial download of the metrics may take a while.