Fig. 2
Download original image
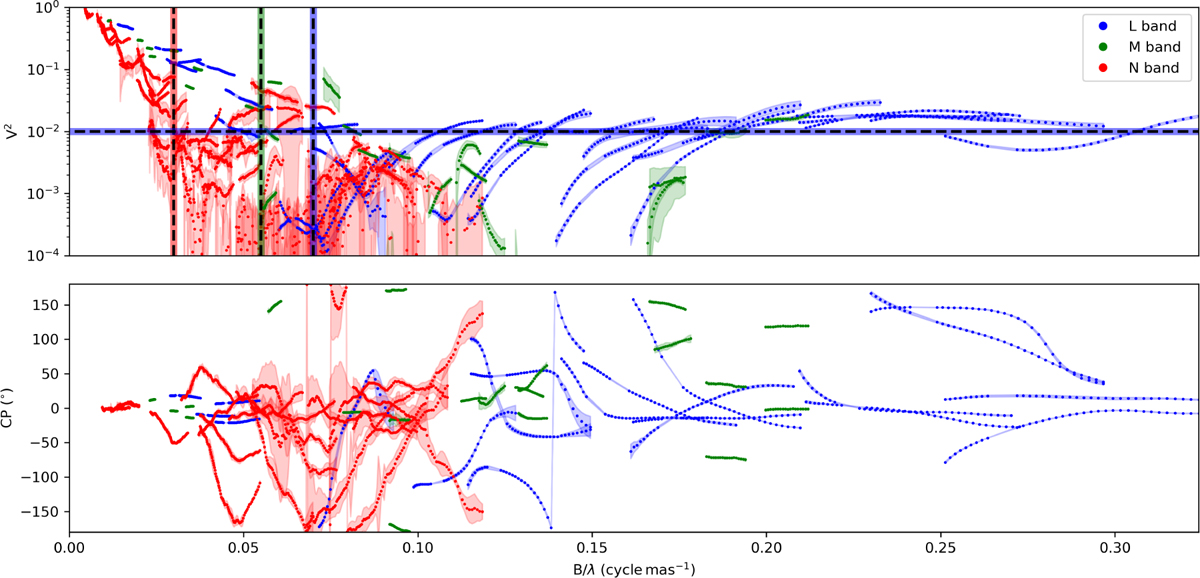
VLTI/MATISSE squared visibility data, denoted V2, in logarithmic scale (top plot) and closure phase data, denoted CP, (bottom plot) of 3 Puppis in the L- (blue), M- (green), and N- (red) bands, plotted as a function of spatial frequency B/λ. The vertical dashed lines indicate the approximate positions of the first visibility nulls in the three bands with the same colour code. The horizontal dashed line marks the visibility plateau at long baselines in the L-band, which reflects the relative flux contribution from the unresolved central source.
Current usage metrics show cumulative count of Article Views (full-text article views including HTML views, PDF and ePub downloads, according to the available data) and Abstracts Views on Vision4Press platform.
Data correspond to usage on the plateform after 2015. The current usage metrics is available 48-96 hours after online publication and is updated daily on week days.
Initial download of the metrics may take a while.